Fires · Indonesia

FireLine

Every satellite fire hotspot across Indonesia, the plantations it falls on, a satellite image for each case and a field check by phone.

Arrow keys or a game controller to move · Enter to open

Satellite images: contains modified Copernicus Sentinel data 2026 (QuickFire by Pierre Markuse), Microsoft Planetary Computer.

Three satellitesSuomi NPP, NOAA-20 and NOAA-21
Four weeksof hotspot history at hand
Every casewith satellite images before and after
One linkfrom the office to the field team

Two views

The whole country, and your own plantations.

Every account

Indonesia

  • Every VIIRS hotspot on land in Indonesia, the last four weeks
  • By province, district and plantation company
  • Plantation boundaries from RSPO, Global Forest Watch and Earthline's own data
  • Area of plantation reached by hotspots, latest detections first

Your supply base

Company

  • Only hotspots inside or within 500 m of your plots
  • One case per company over seven days, ranked by priority
  • Satellite images, route and field check for each case
  • Sent to the field team by WhatsApp, followed until it is closed

What it does

Built for the people who have to act on a fire.

Priority inbox

Newest first, inside the plot first, strongest first: fire radiative power, repeated days and fires still burning push a case up.

Fire events

Detections grouped over consecutive days, so a fire that keeps burning stands out from a one-off hotspot.

Route to the fire

Distance and direction from your position or from the nearest mill, with a route in Google Maps or Waze.

Map tools

Measure a distance or an area, read coordinates, draw a 0.5 to 5 km radius around a hotspot.

Four weeks of history

Pick any range within 28 days, see each day's hotspots, and export the list as CSV.

Print or share

Each case prints as a one-page report, and a daily summary goes out by WhatsApp.

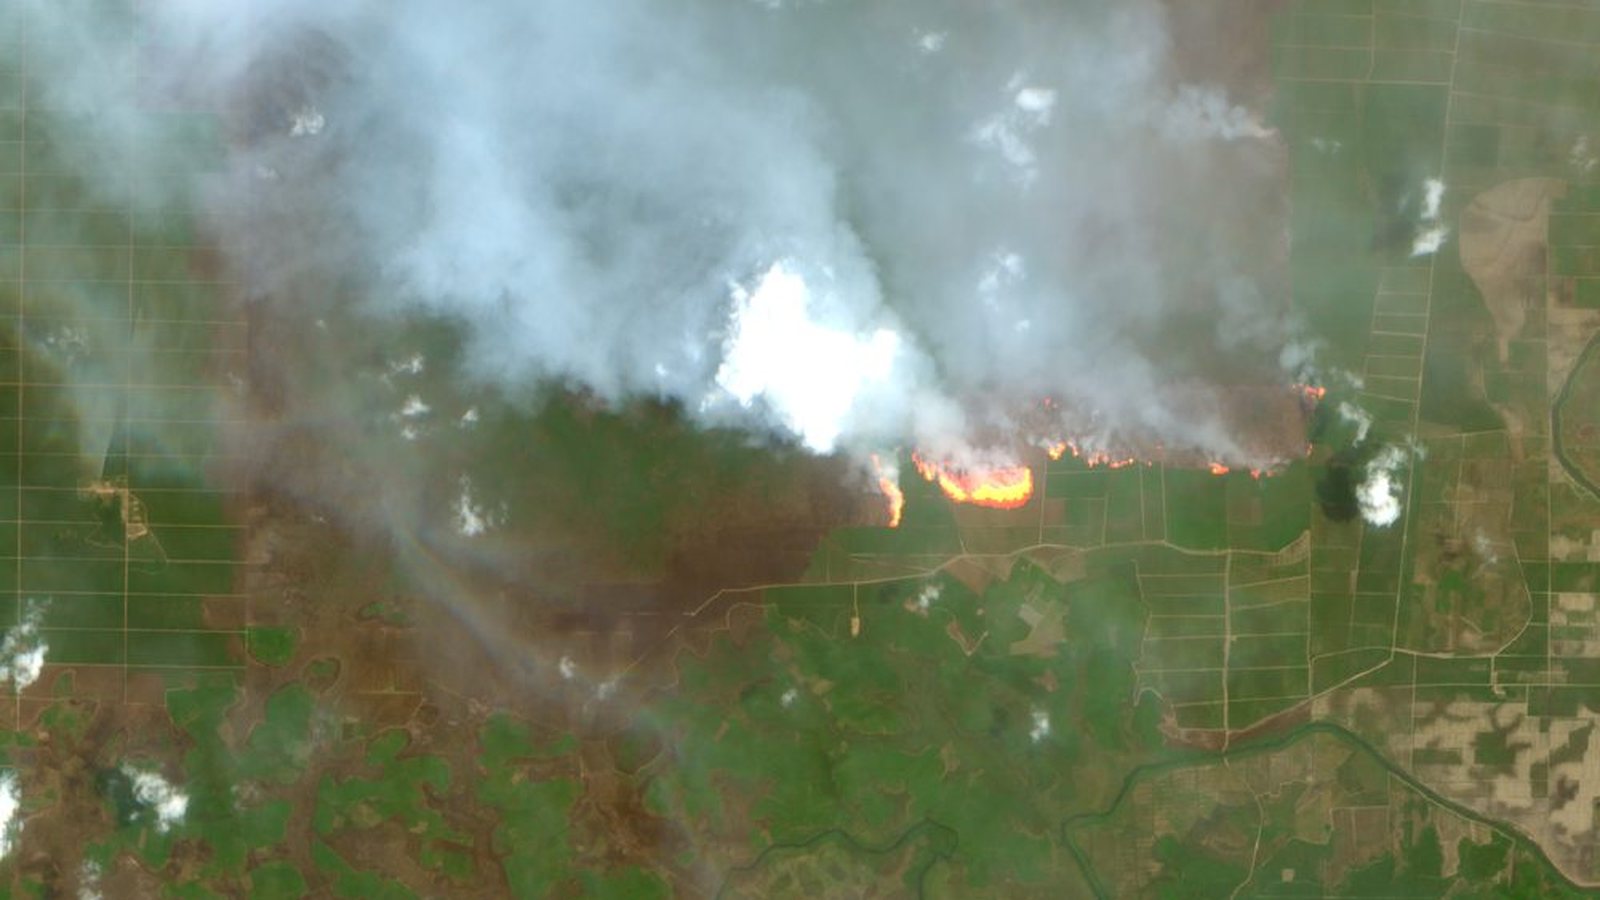
Sentinel-2 QuickFire view of a peat fire under smoke, South Sumatra
Sentinel-2, QuickFire style, 8 October 2026: a peat fire in South Sumatra under its own smoke.

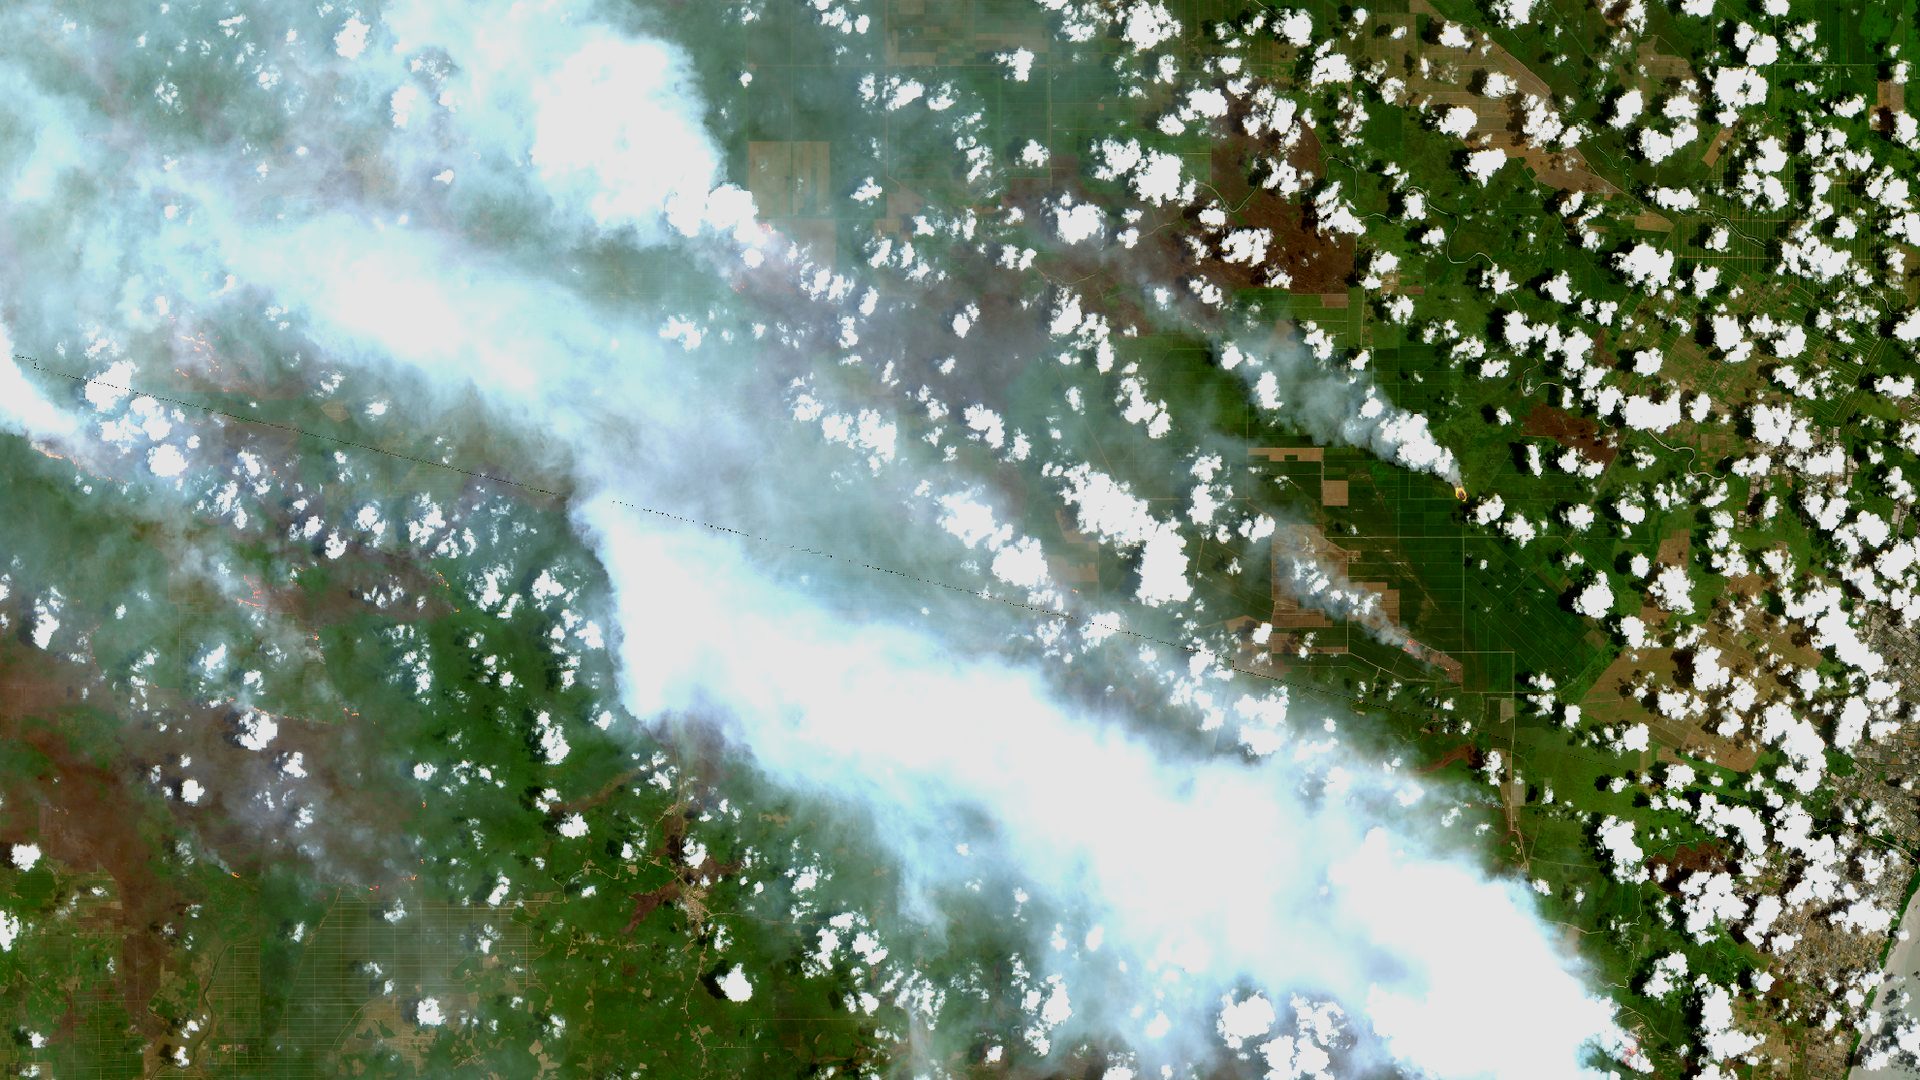
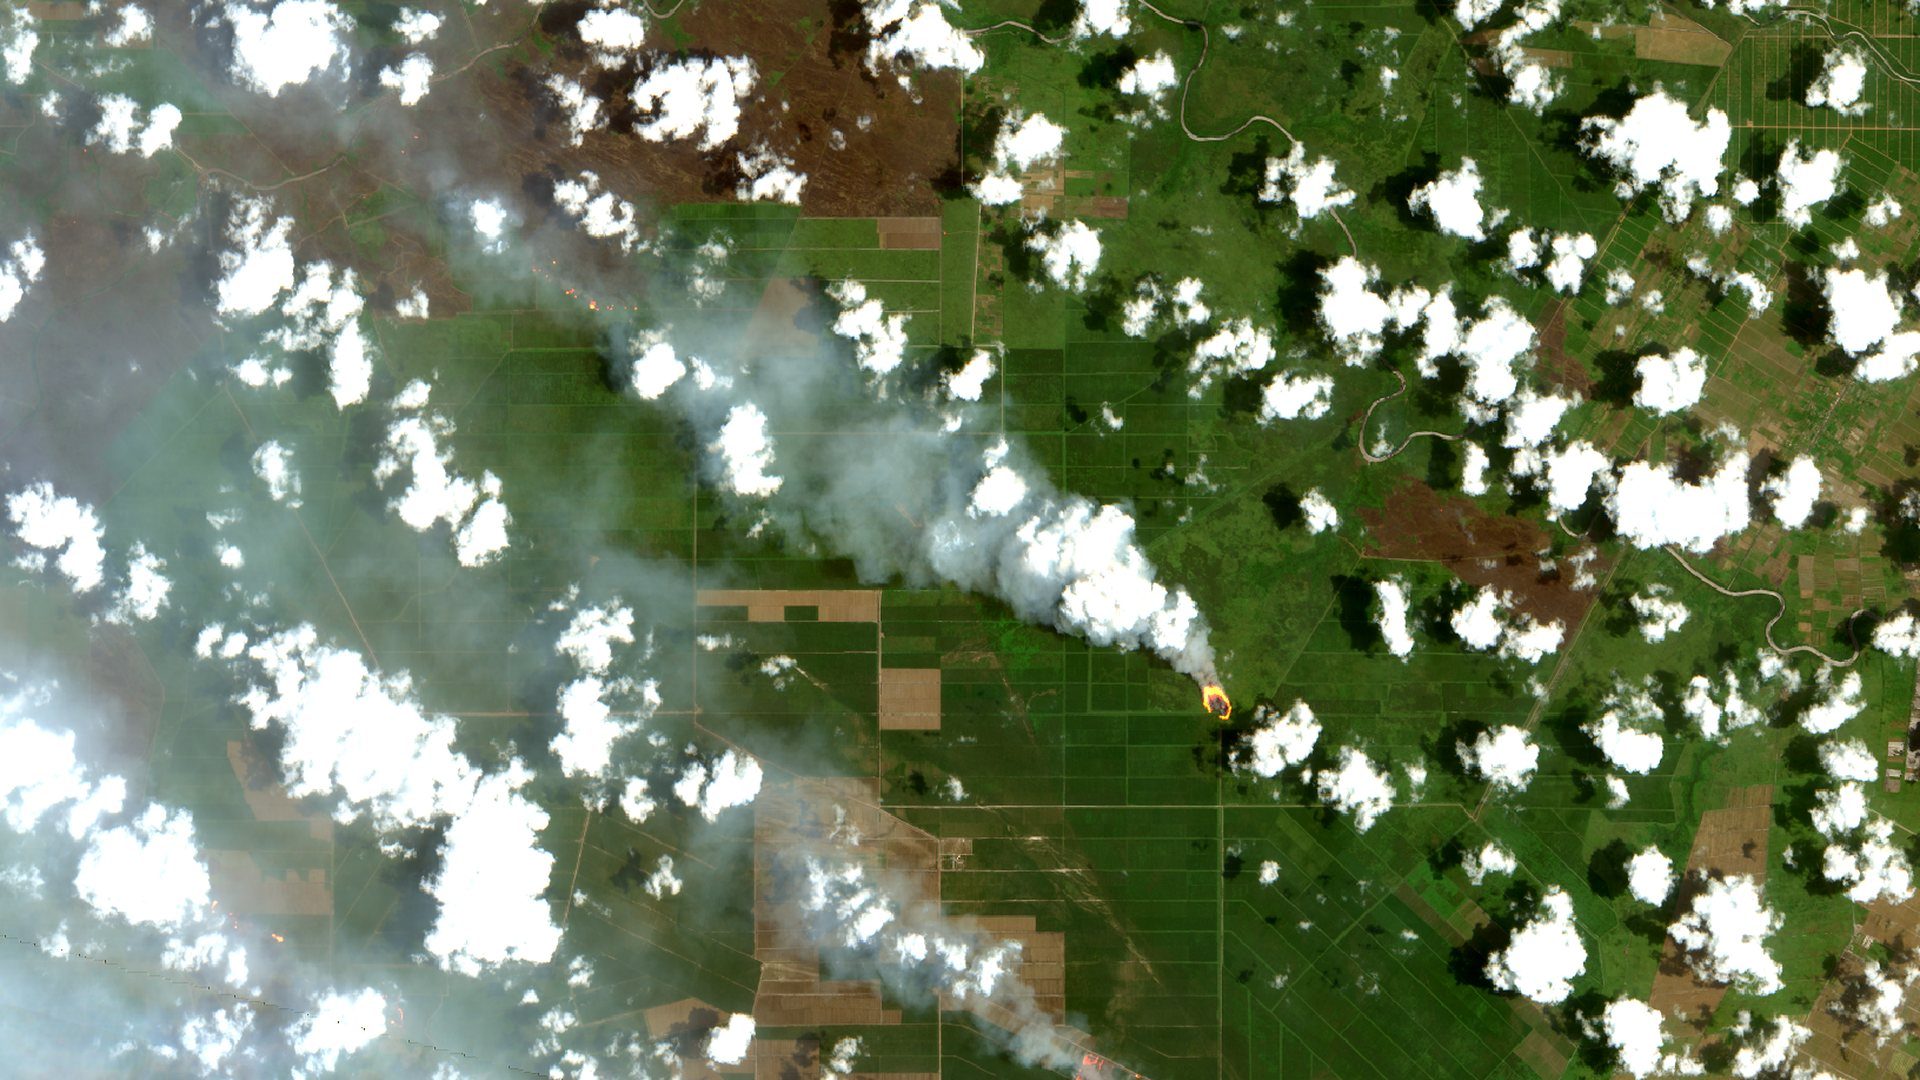
Satellite images

See the fire under the smoke.

Every case lists the Sentinel-2 passes from two months before the fire to today, with their cloud cover, and opens the one closest to the fire date.

  • QuickFire: the flame front shows through thin smoke
  • Burn scars in short-wave infrared, before and after
  • Sentinel-1 radar when clouds cover the area
  • One click to the same place in Copernicus Browser
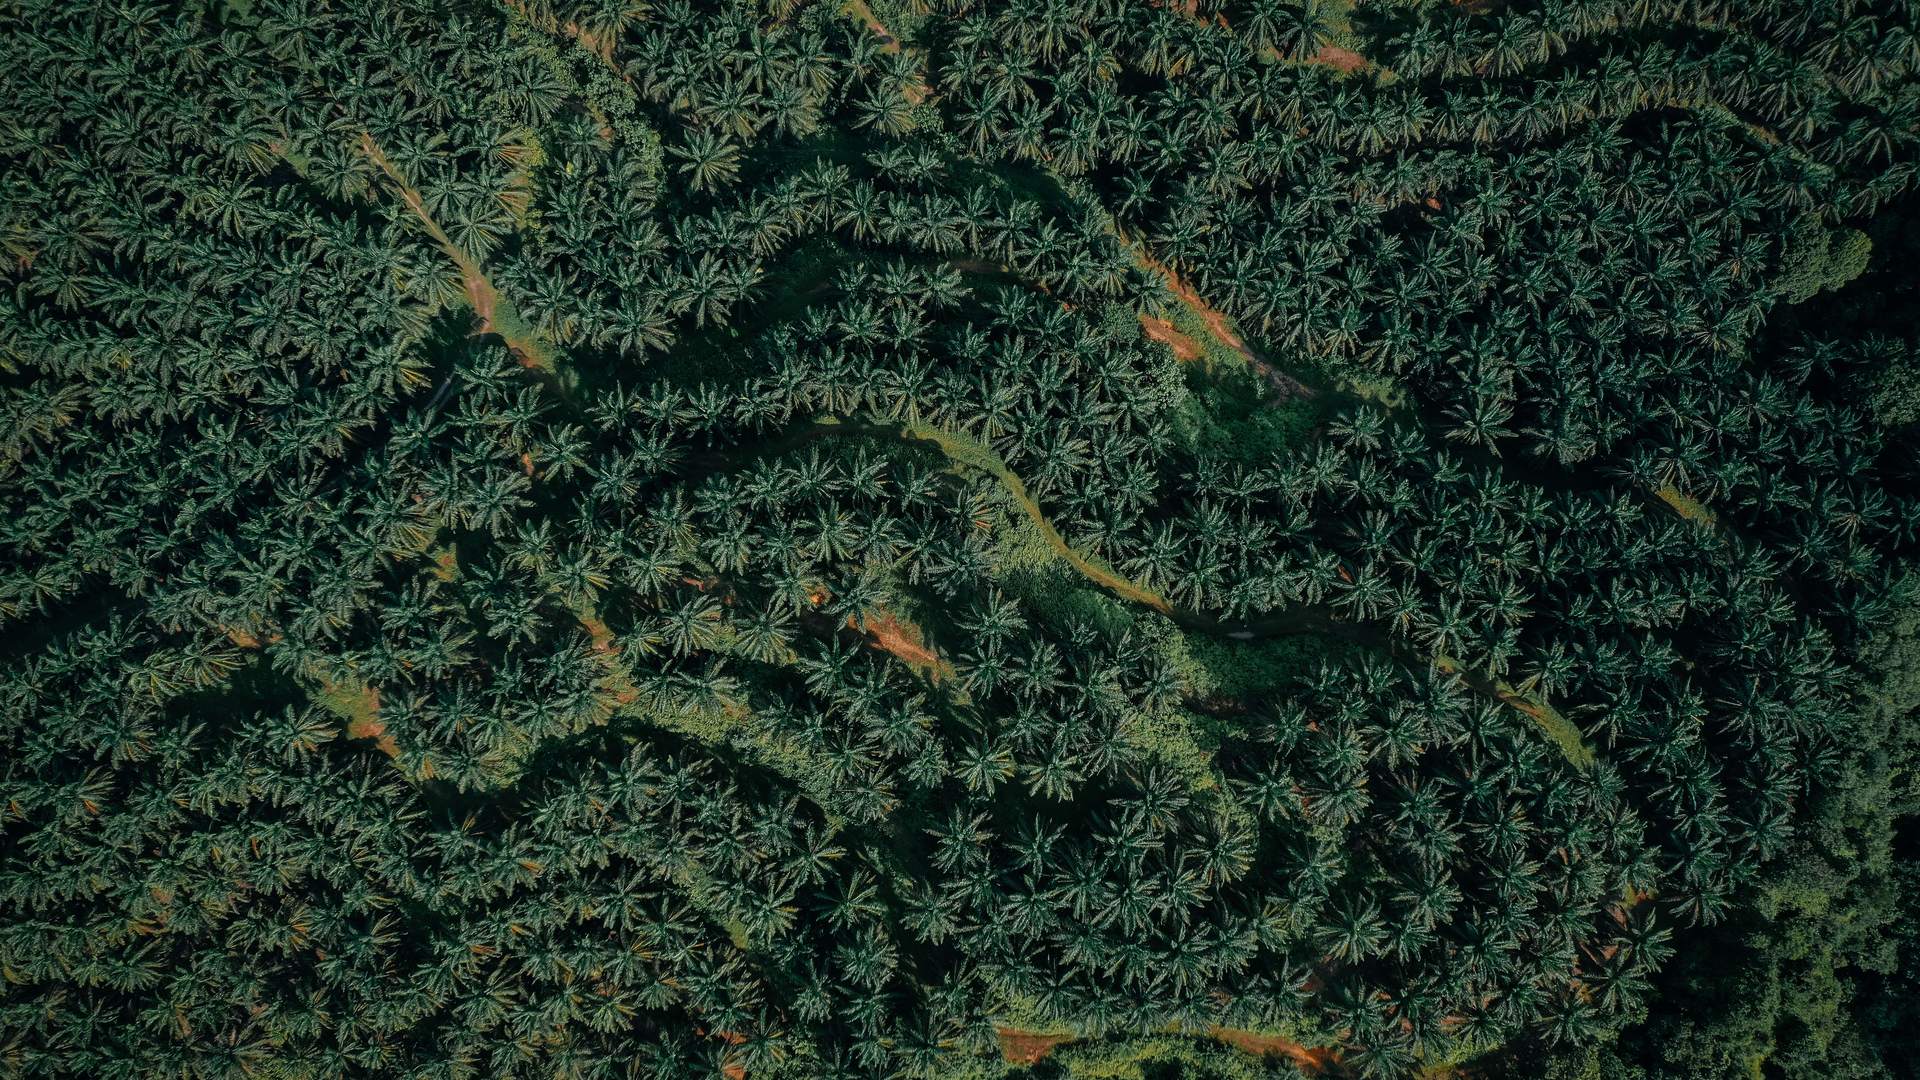
Oil palm canopy seen from above

In the field

From the office to the field team in one link.

The office sends a case by WhatsApp. The link opens a page on the phone, no app and no account, valid for seven days.

  • A small map with the plot, the hotspot, the mill and the team's own position
  • Live distance and direction while walking to the spot
  • Report: still burning, put out, or a false alarm, with up to three photos
  • Drafts kept on the phone when the signal drops

How it works

From a hotspot to a checked case.

  1. 1

    Detect

    Hotspots arrive from NASA FIRMS several times a day and are matched to provinces, districts and plantations.

  2. 2

    Locate

    Each case opens on the map with its plantation, the nearest mill and a route by Google Maps or Waze.

  3. 3

    Verify

    The field team gets a link on the phone, goes to the spot and reports: active, put out or a false alarm.

  4. 4

    Document

    Photos, notes and satellite images stay with the case, ready to print or to share.

Data

Open sources, refreshed through the day.

NASA FIRMS · VIIRSHotspots at 375 m from Suomi NPP, NOAA-20 and NOAA-21, several passes a day
Copernicus Sentinel-210–20 m images every few days: true colour, burn scars, QuickFire
Copernicus Sentinel-1Radar that sees through cloud, for the wet-season passes
RSPO and Global Forest WatchPublished concession boundaries and company names
KLHK burned areasThe ministry's burned-area polygons for 2026
BPS boundariesProvinces and districts (2020) for the national figures

Questions

What people ask first.

Is every hotspot a fire?

No. A VIIRS hotspot is a 375 m pixel hotter than its surroundings: it can be a fire, a flare or a hot roof. That is why each case ends with a field check, and "false alarm" is one of the answers.

How fresh is the data?

NASA publishes VIIRS hotspots within about three hours of each pass, several times a day. FireLine shows when its data was last fetched and can be refreshed on demand.

Does the field team need an account?

No. They get a link by WhatsApp that opens in the phone's browser and works for seven days.

What if there is smoke or cloud?

Hotspots don't depend on the image. For the picture, QuickFire sees through thin smoke and Sentinel-1 radar through cloud; thick smoke can still hide the ground.

Which plantations are covered?

The Indonesia view covers every company with a published boundary. The Company view covers the plots of your own supply base.

Fires don't wait for the next report.

FireLine runs as its own app. Sign in there, or tell us which plantations you want to follow.