
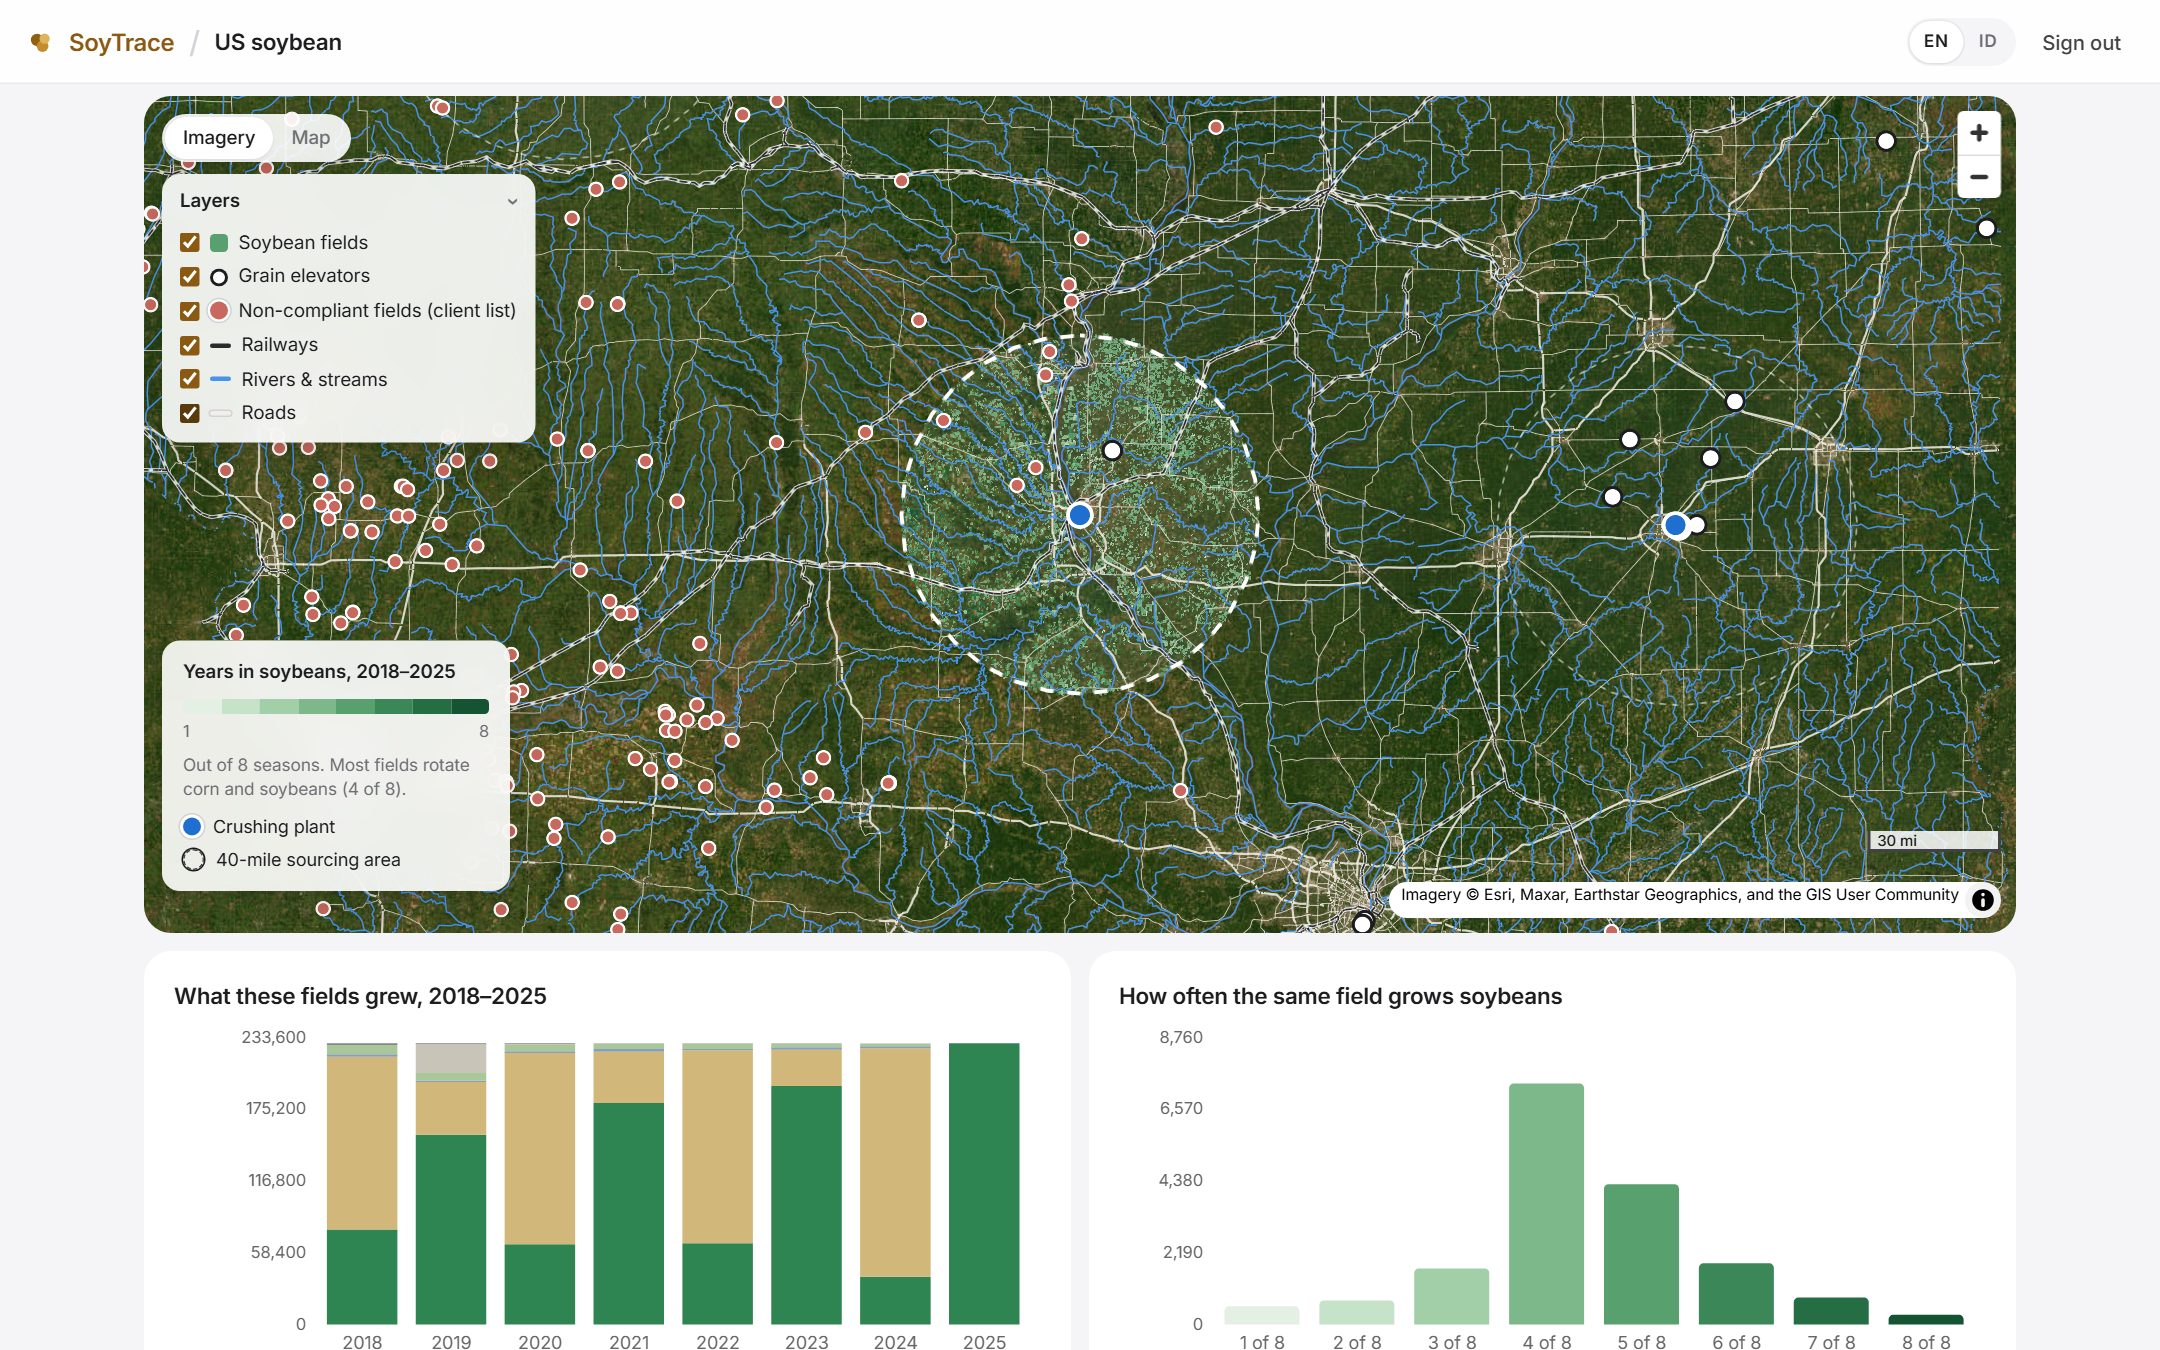
Sourcing areas on a map
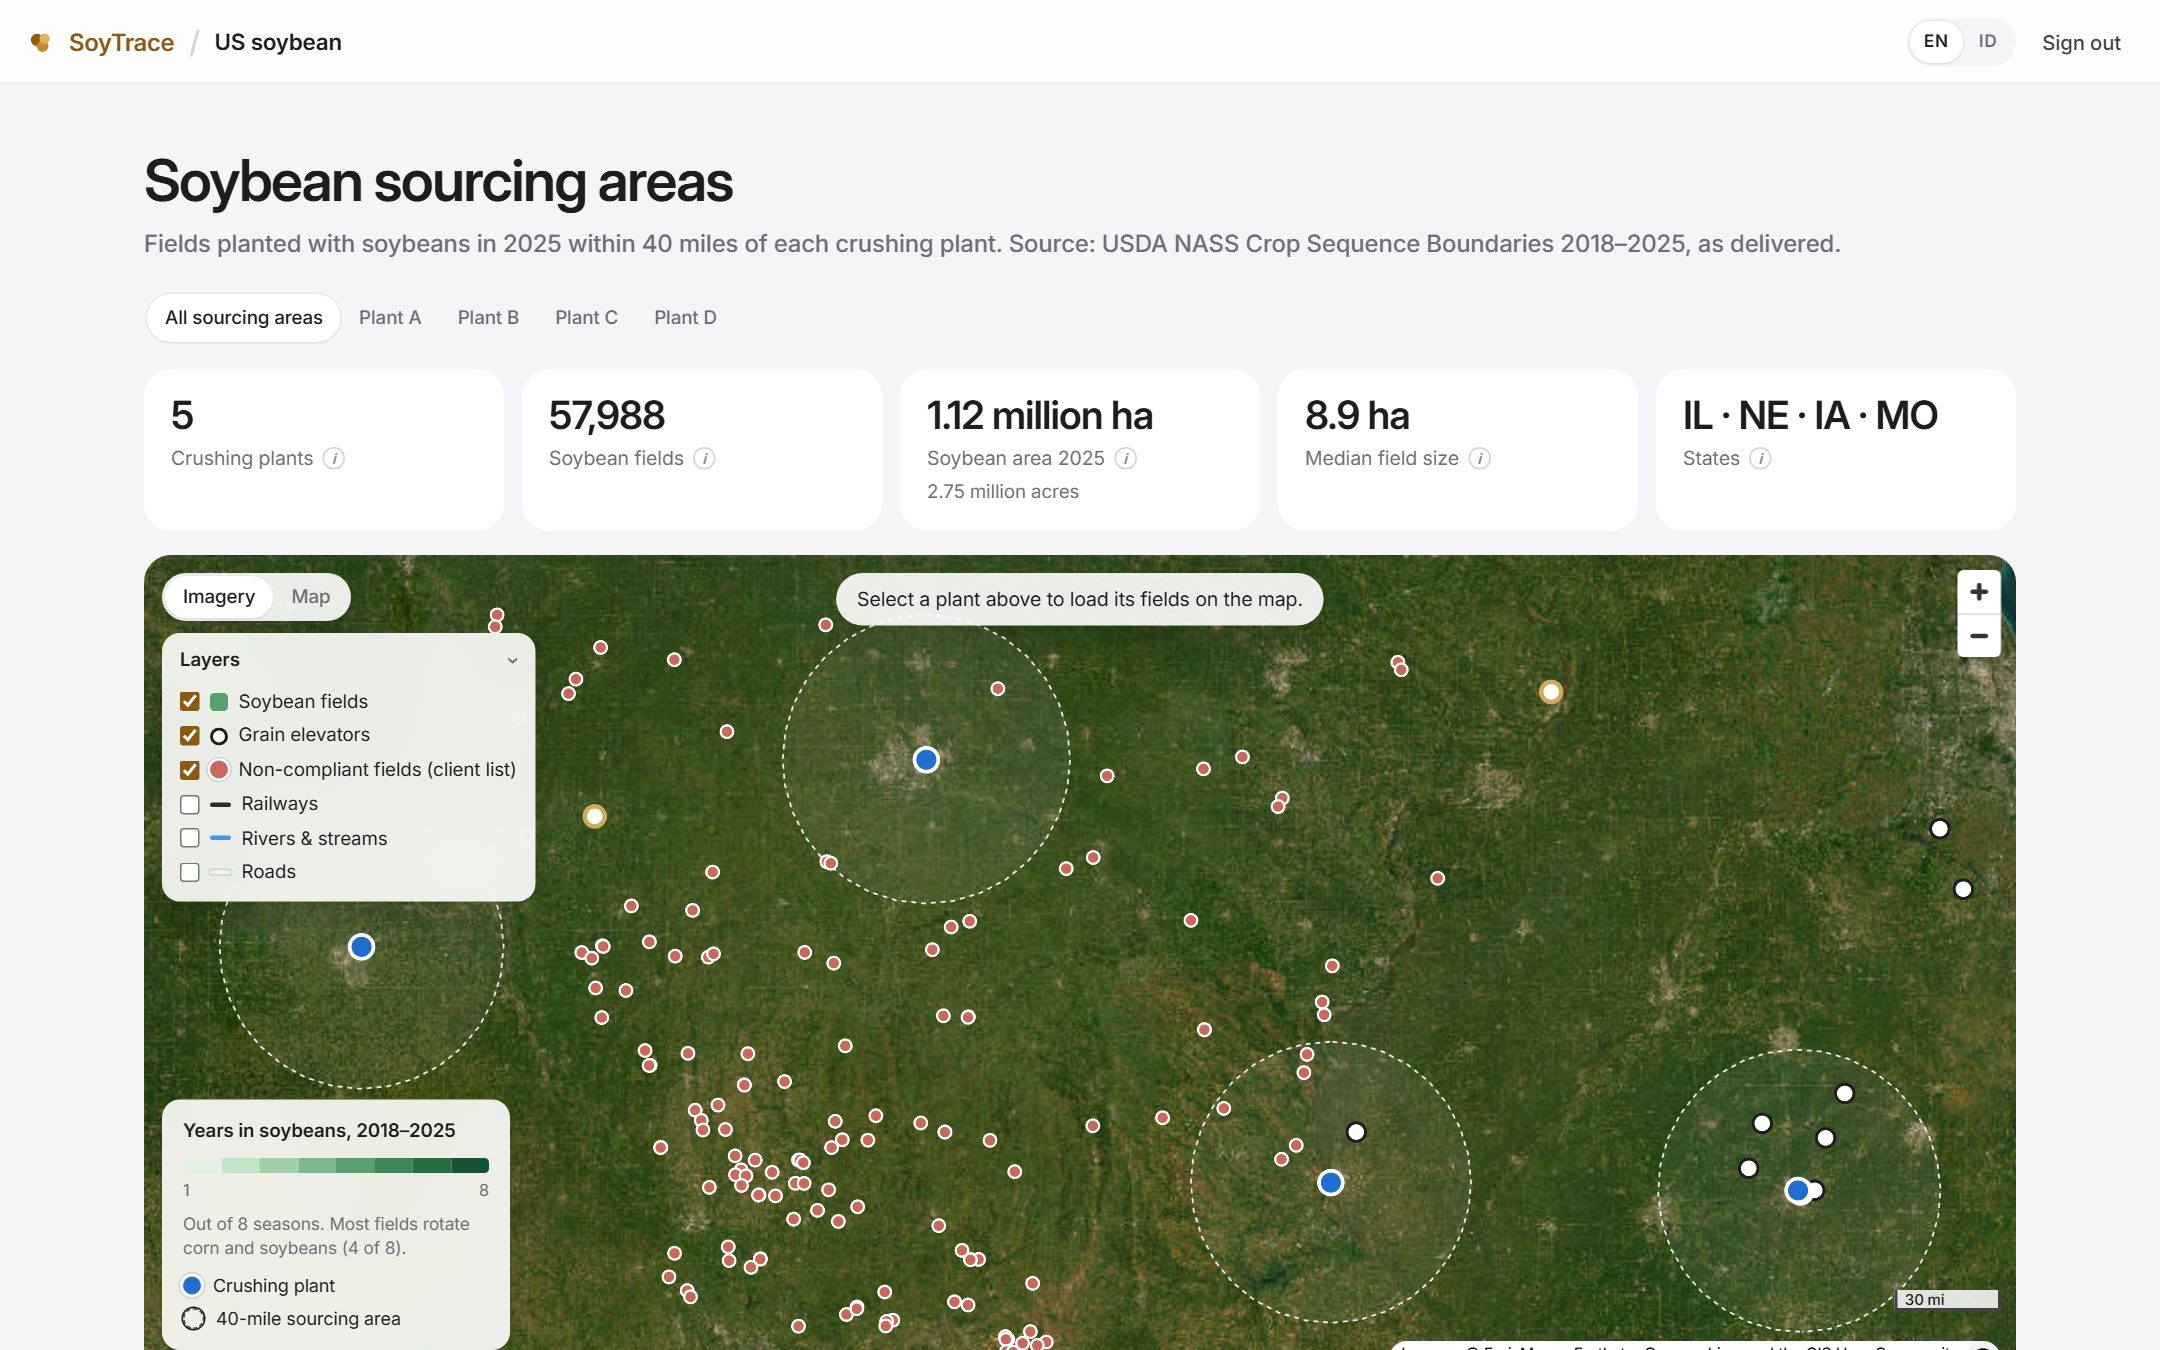
Each crushing plant with its sourcing radius and the soybean fields inside, over current imagery.
SoyTrace by Earthline
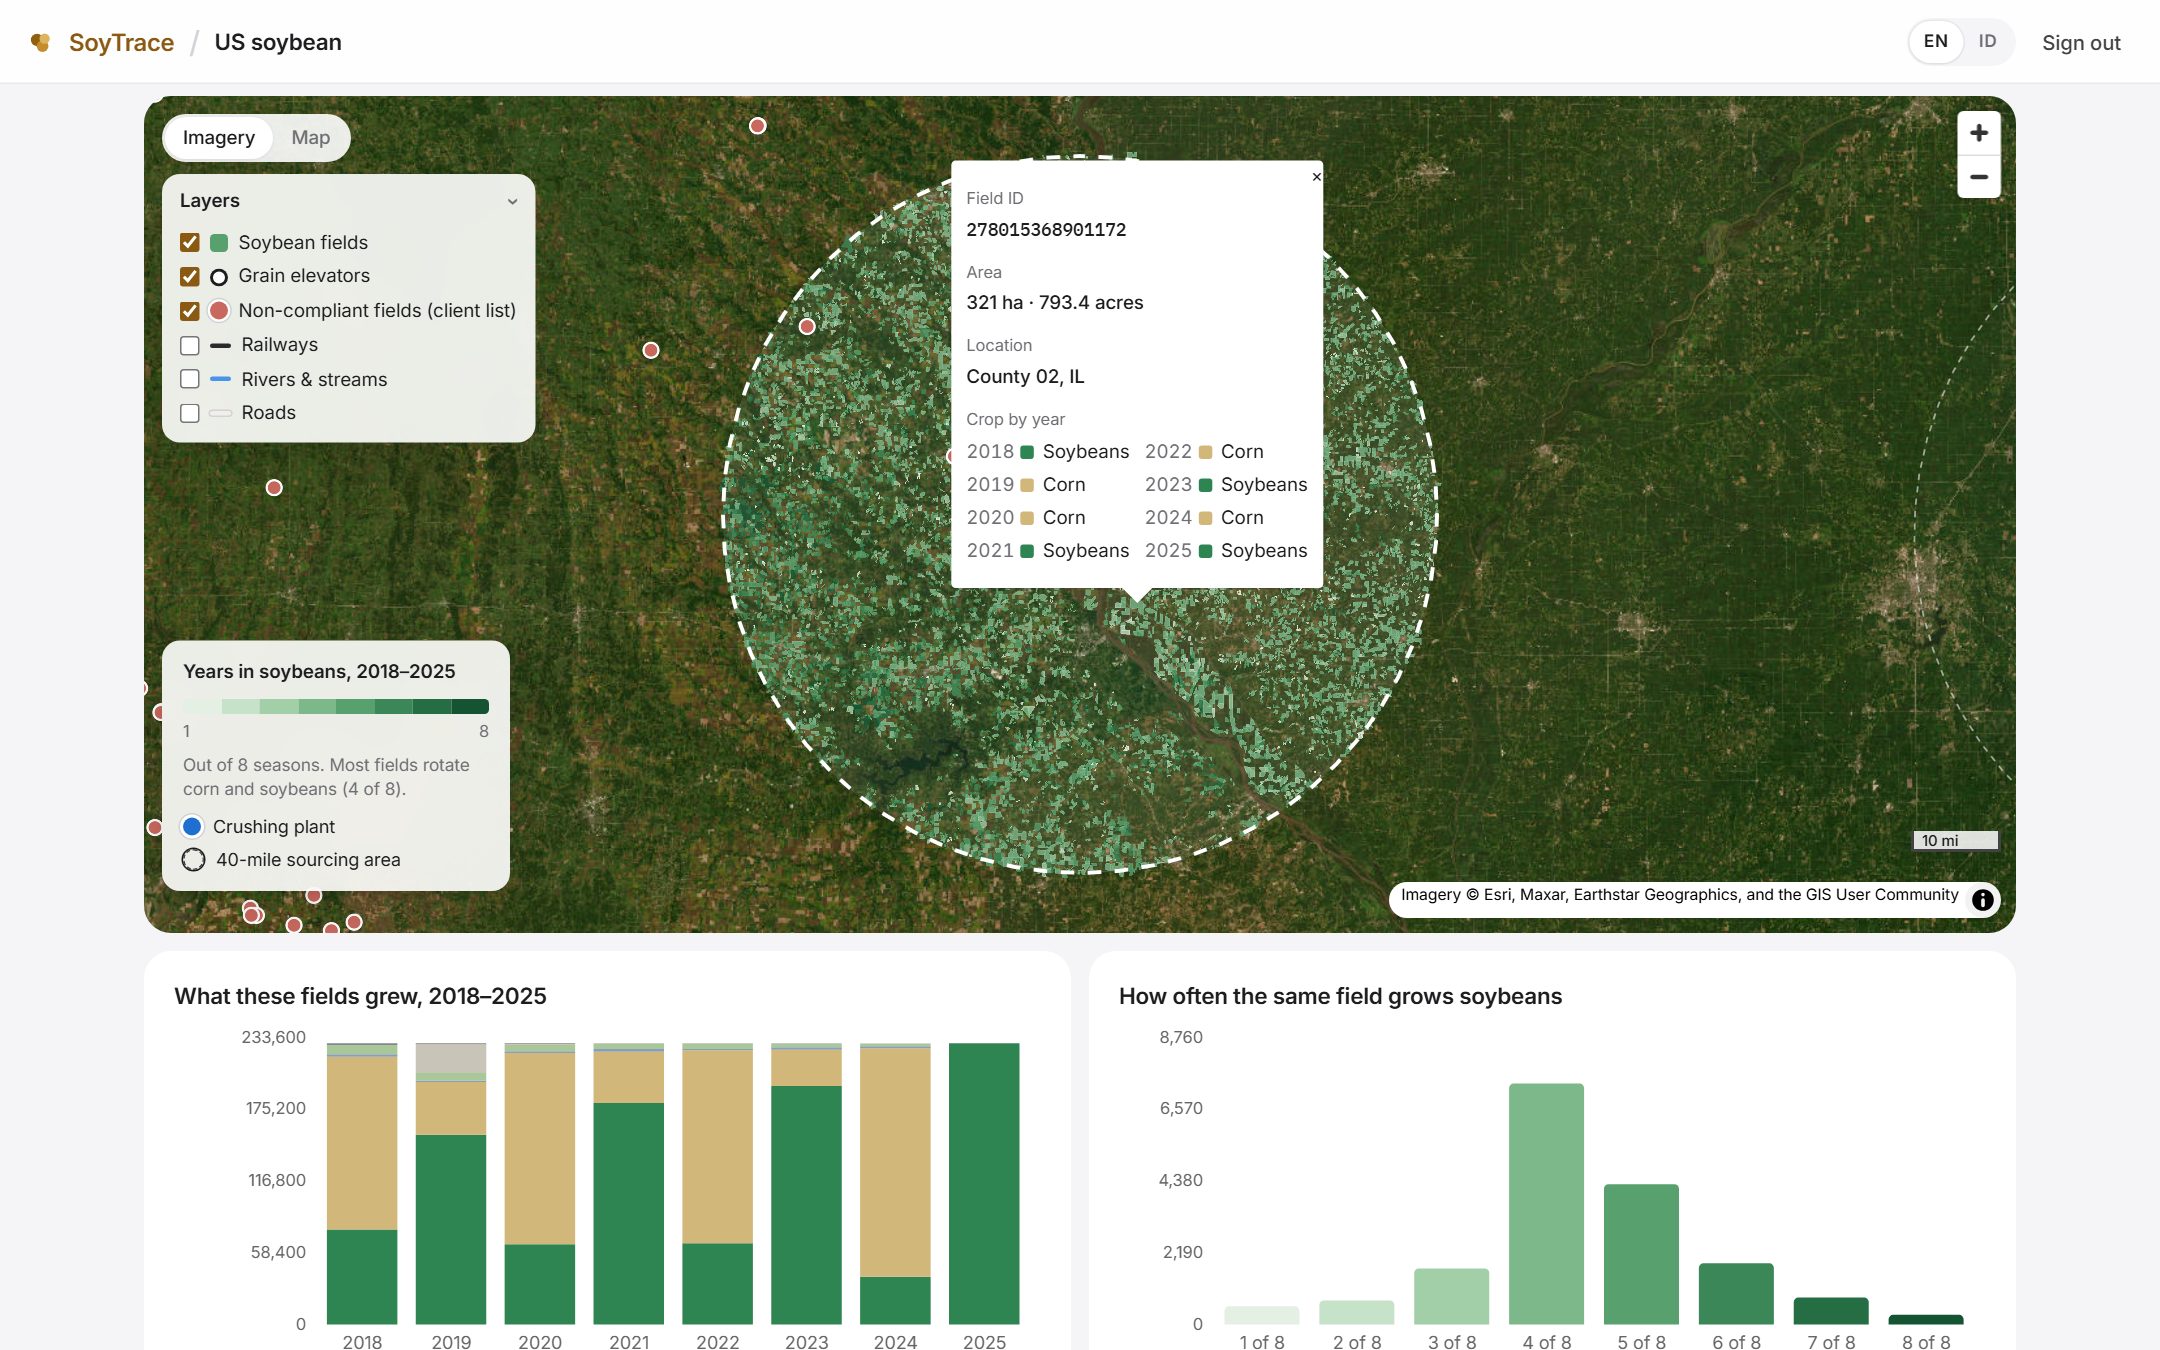
SoyTrace draws each plant's sourcing area and maps the soybean fields inside it — field by field, with eight seasons of crop history — so you can see what supplies each facility.
Arrow keys or a game controller to move · Enter to open
What you see
Each crushing plant with its sourcing radius and the soybean fields inside, over current imagery.
What every field grew in each of the last eight seasons — rotation, continuous soybeans, recent conversions.
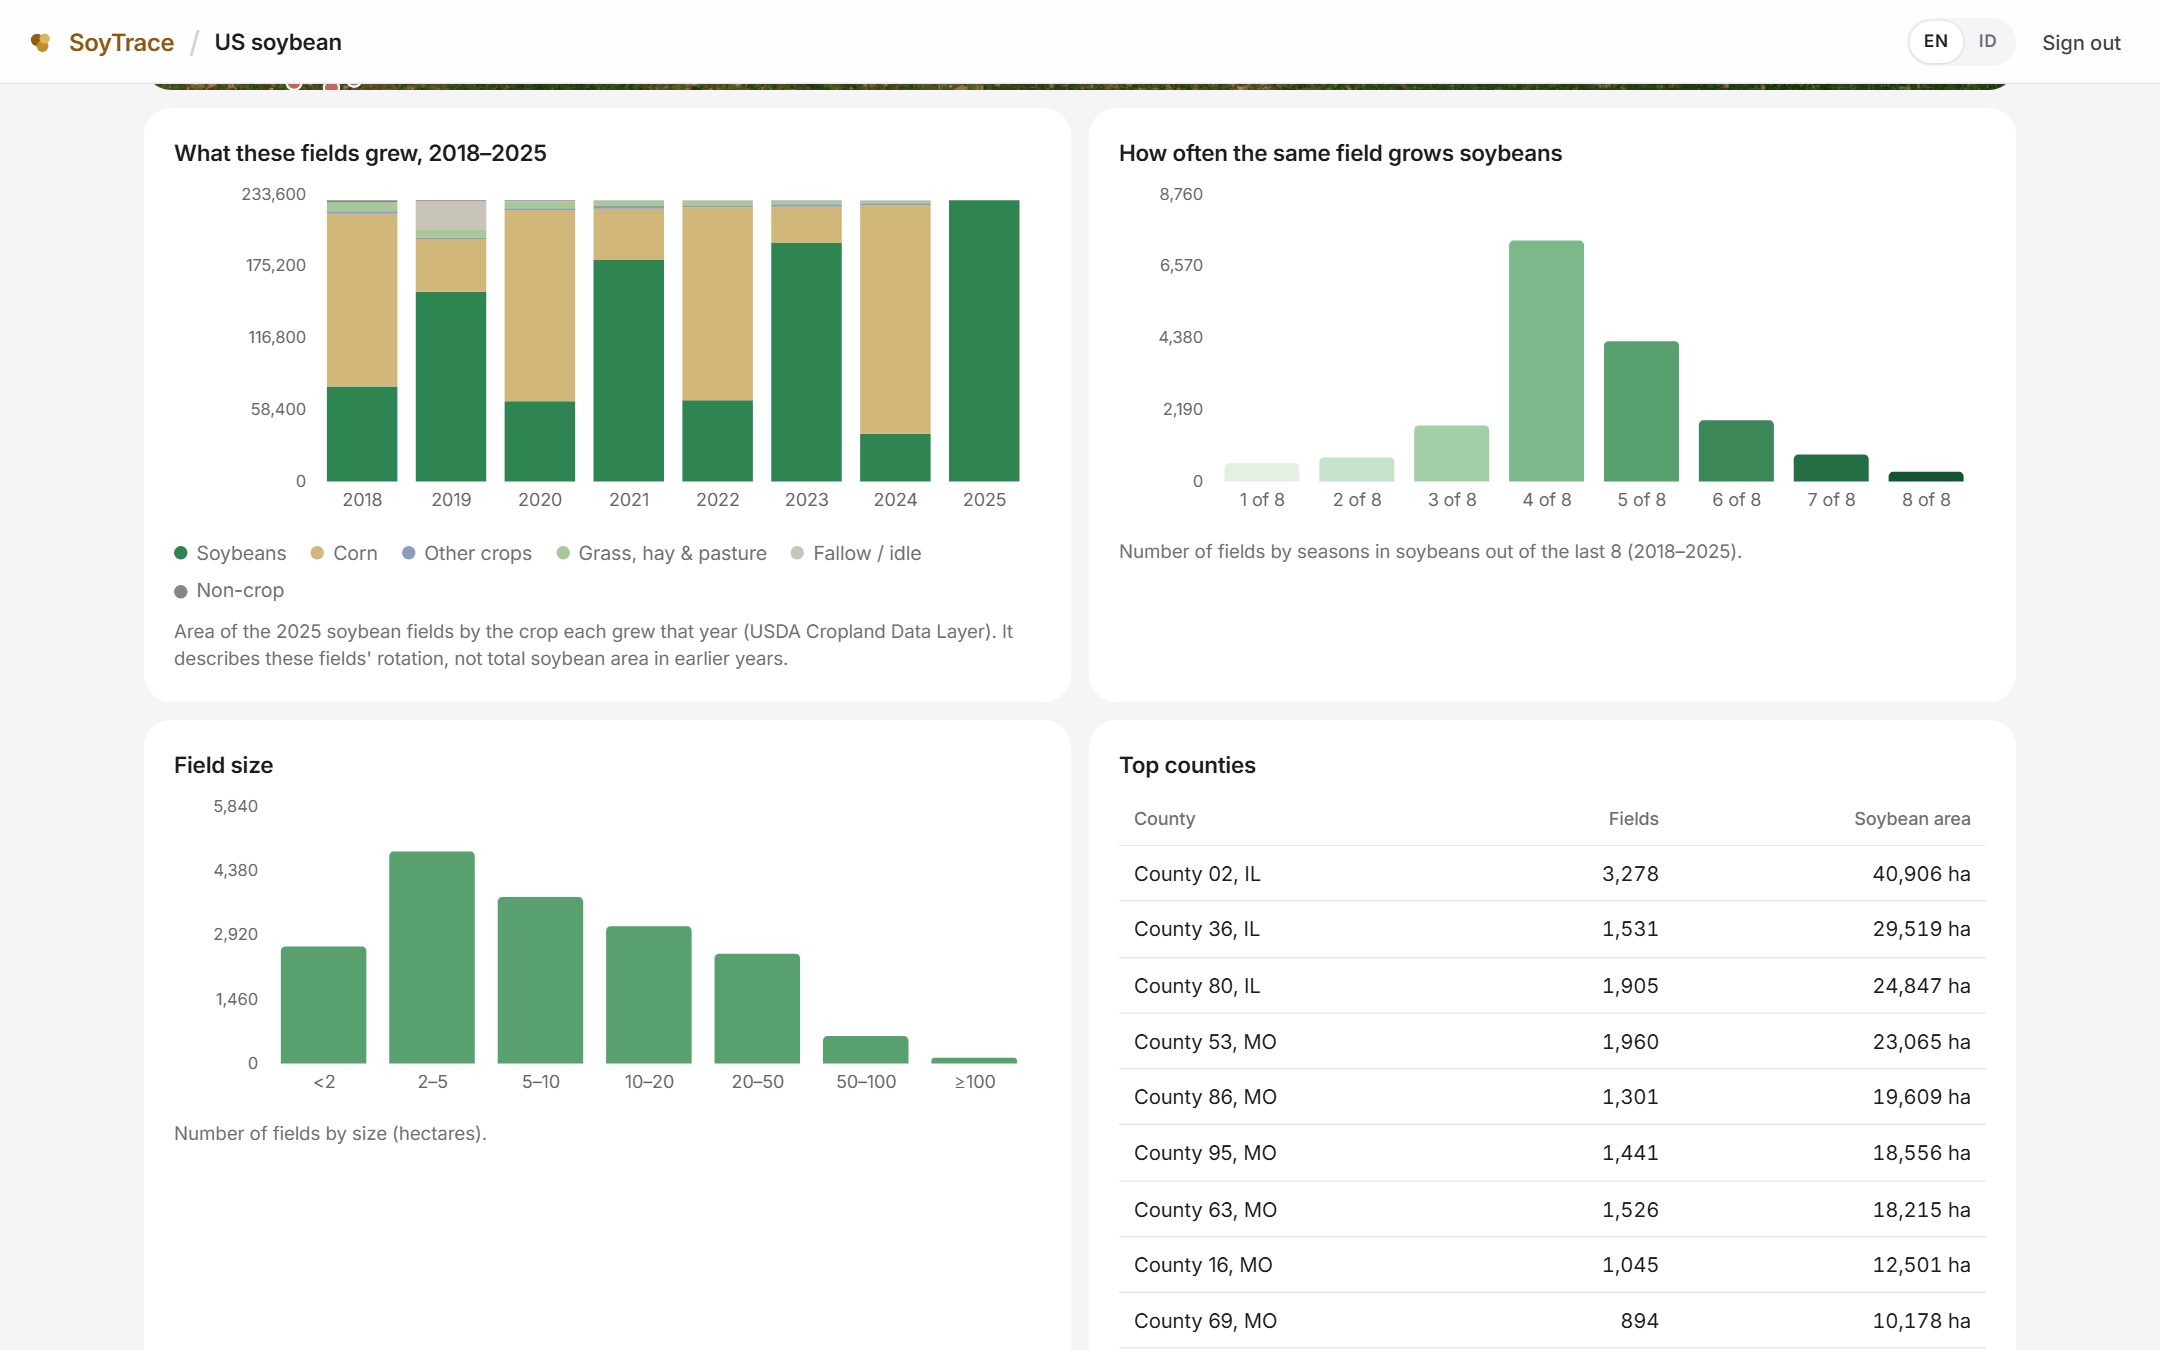
Field counts, soybean area, field sizes, top counties and states — per plant and across all plants.
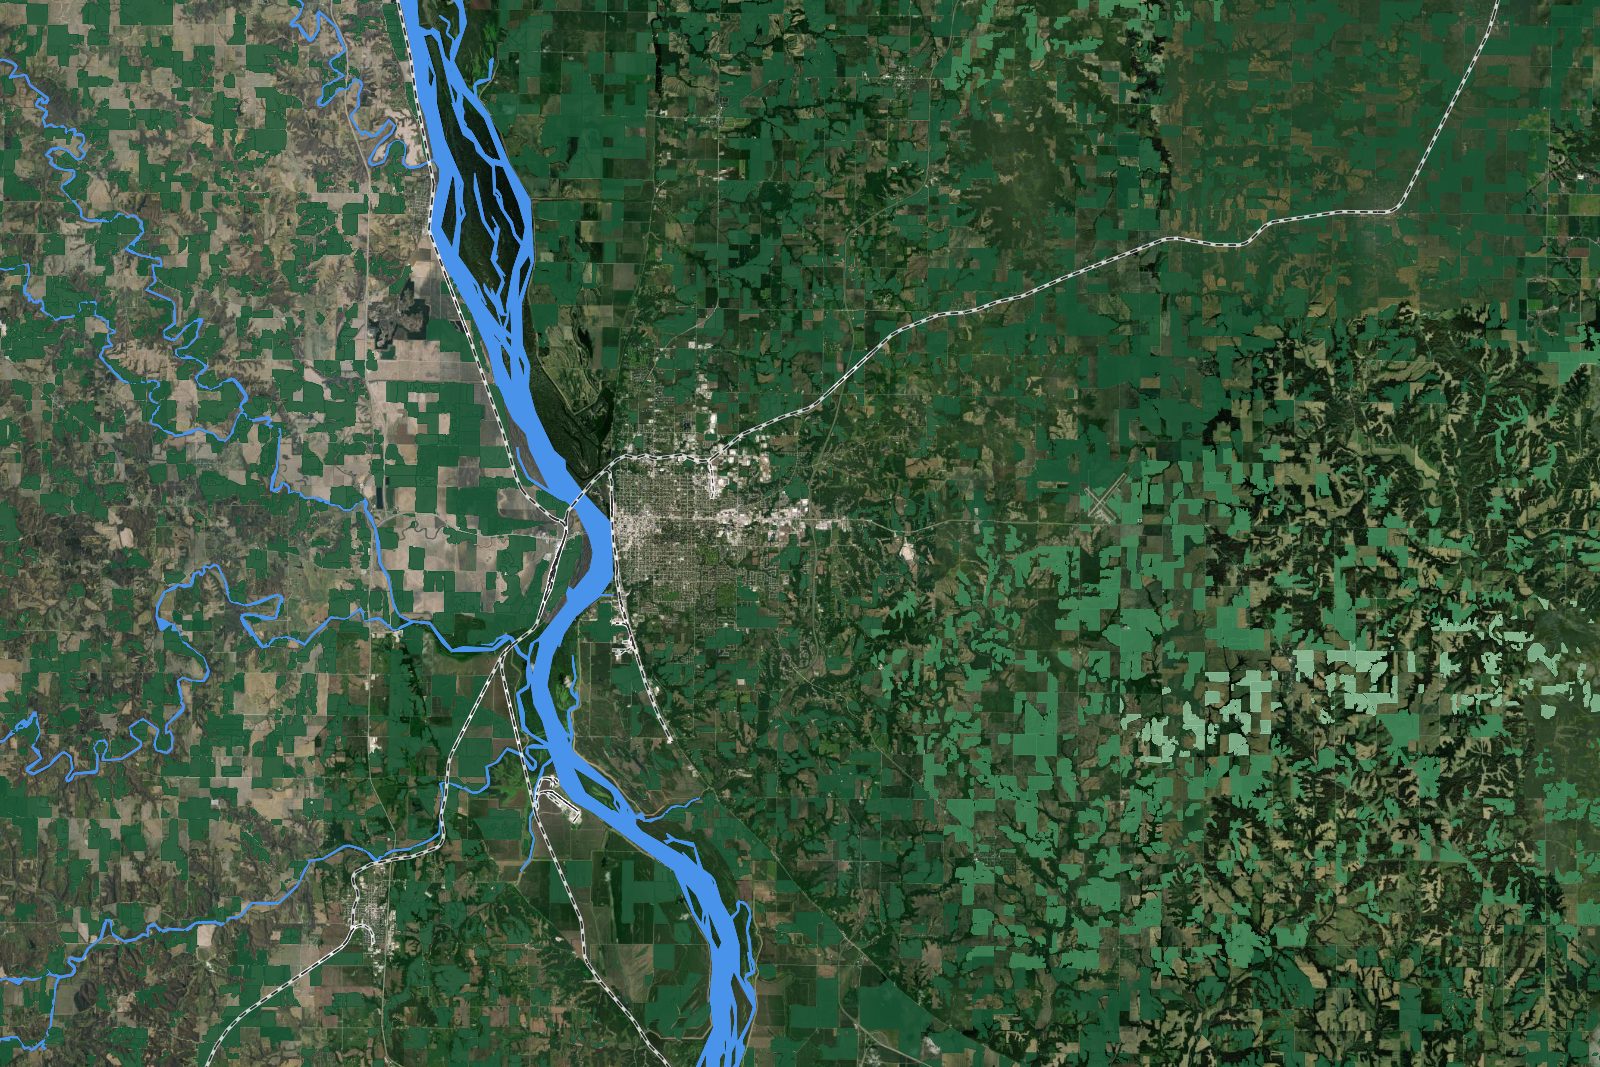
In context
Elevators, rail lines and the river system sit on the same map as the fields, so you can follow how soybeans move from each catchment towards the plant — and see how much of the crop lies within reach of rail or barge, where hauling costs far less than by truck.
How it works
Share the plants in scope and how far each sources from.
We assemble public field boundaries and yearly crop maps for every sourcing area, plus the points and layers you add.
Maps and statistics in one workspace, with periodic reports as the analysis grows.
SoyTrace is invitation-only. Tell us which facilities to start with.