
Plots live everywhere
Polygons sit in a dozen shapefiles, spreadsheets and supplier emails — none of them linked to the mill that buys the fruit.
PalmTrace by Earthline
PalmTrace checks palm supply chains plot by plot against the EUDR cutoff of 31 December 2020 — and keeps the evidence in one place your buyers can follow.
Arrow keys or a game controller to move · Enter to open
The problem
Polygons sit in a dozen shapefiles, spreadsheets and supplier emails — none of them linked to the mill that buys the fruit.
Forest cover, the legal forest estate and your own survey tell three different stories. Mixing them produces verdicts nobody can defend.
A static report can’t show a buyer the plot, the imagery either side of 2020 and the reason a polygon failed.
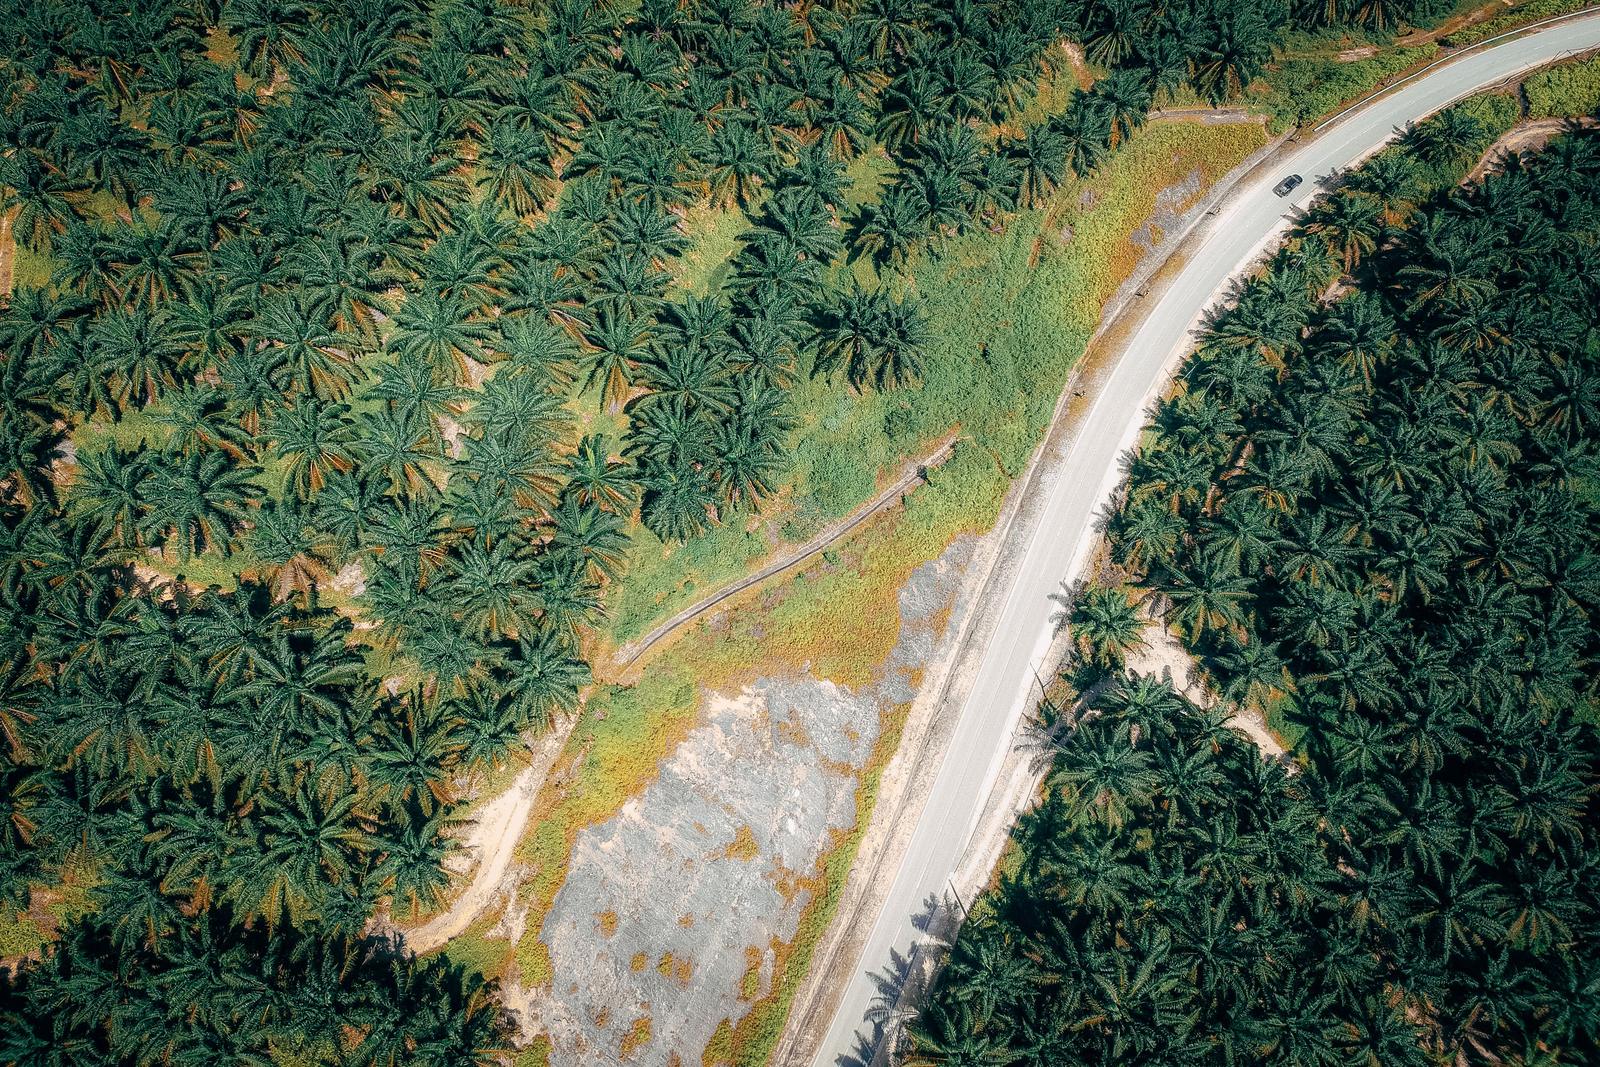
On the ground
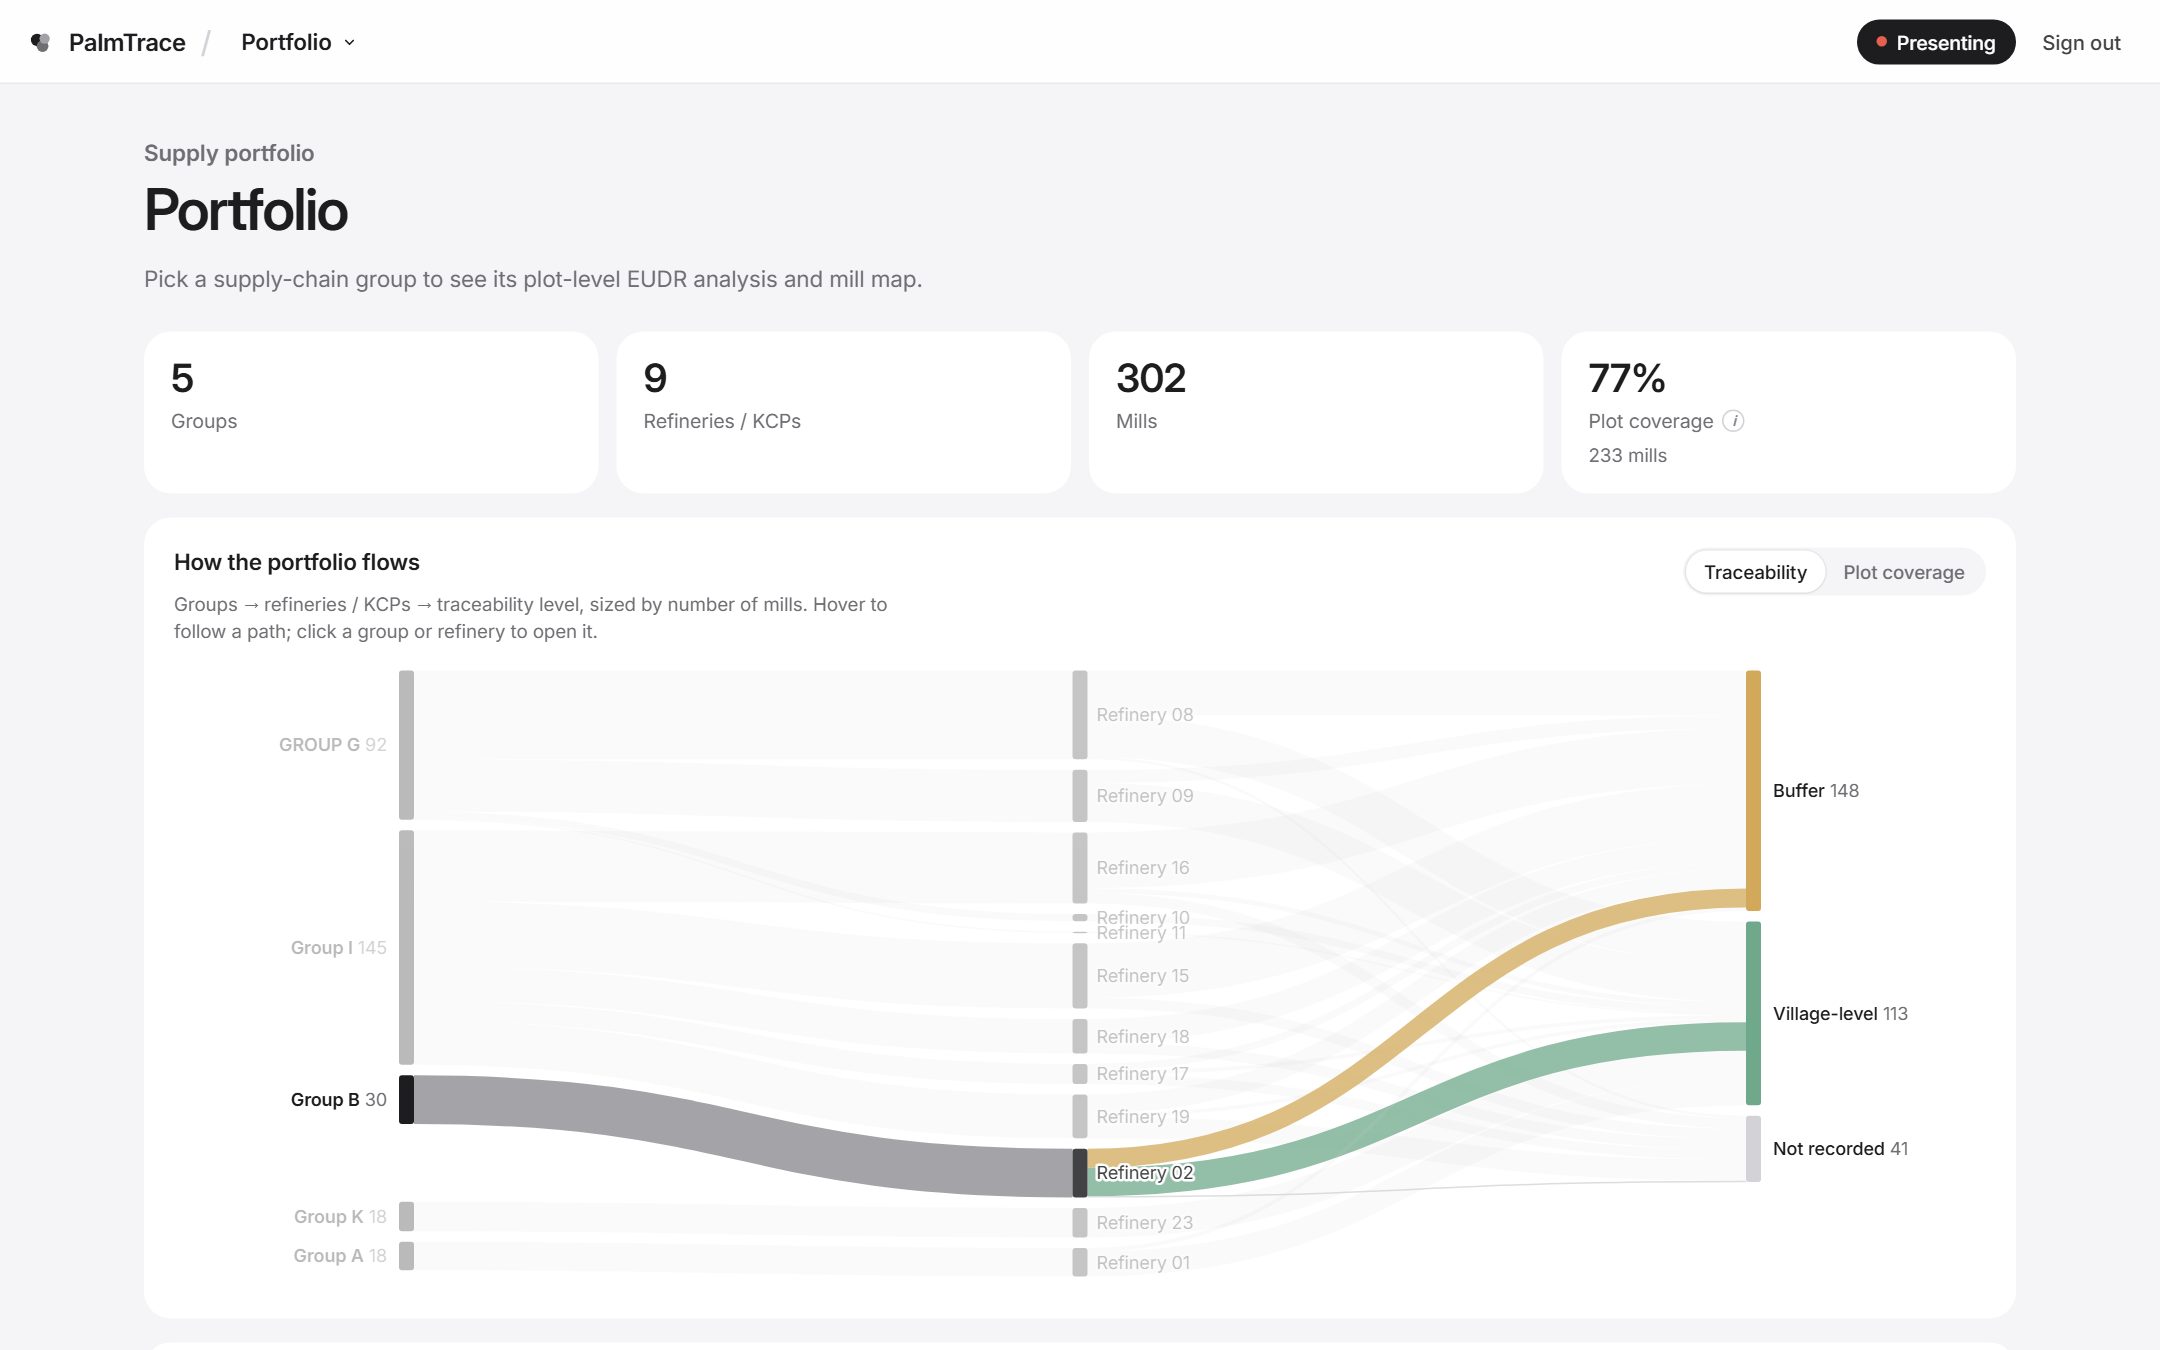
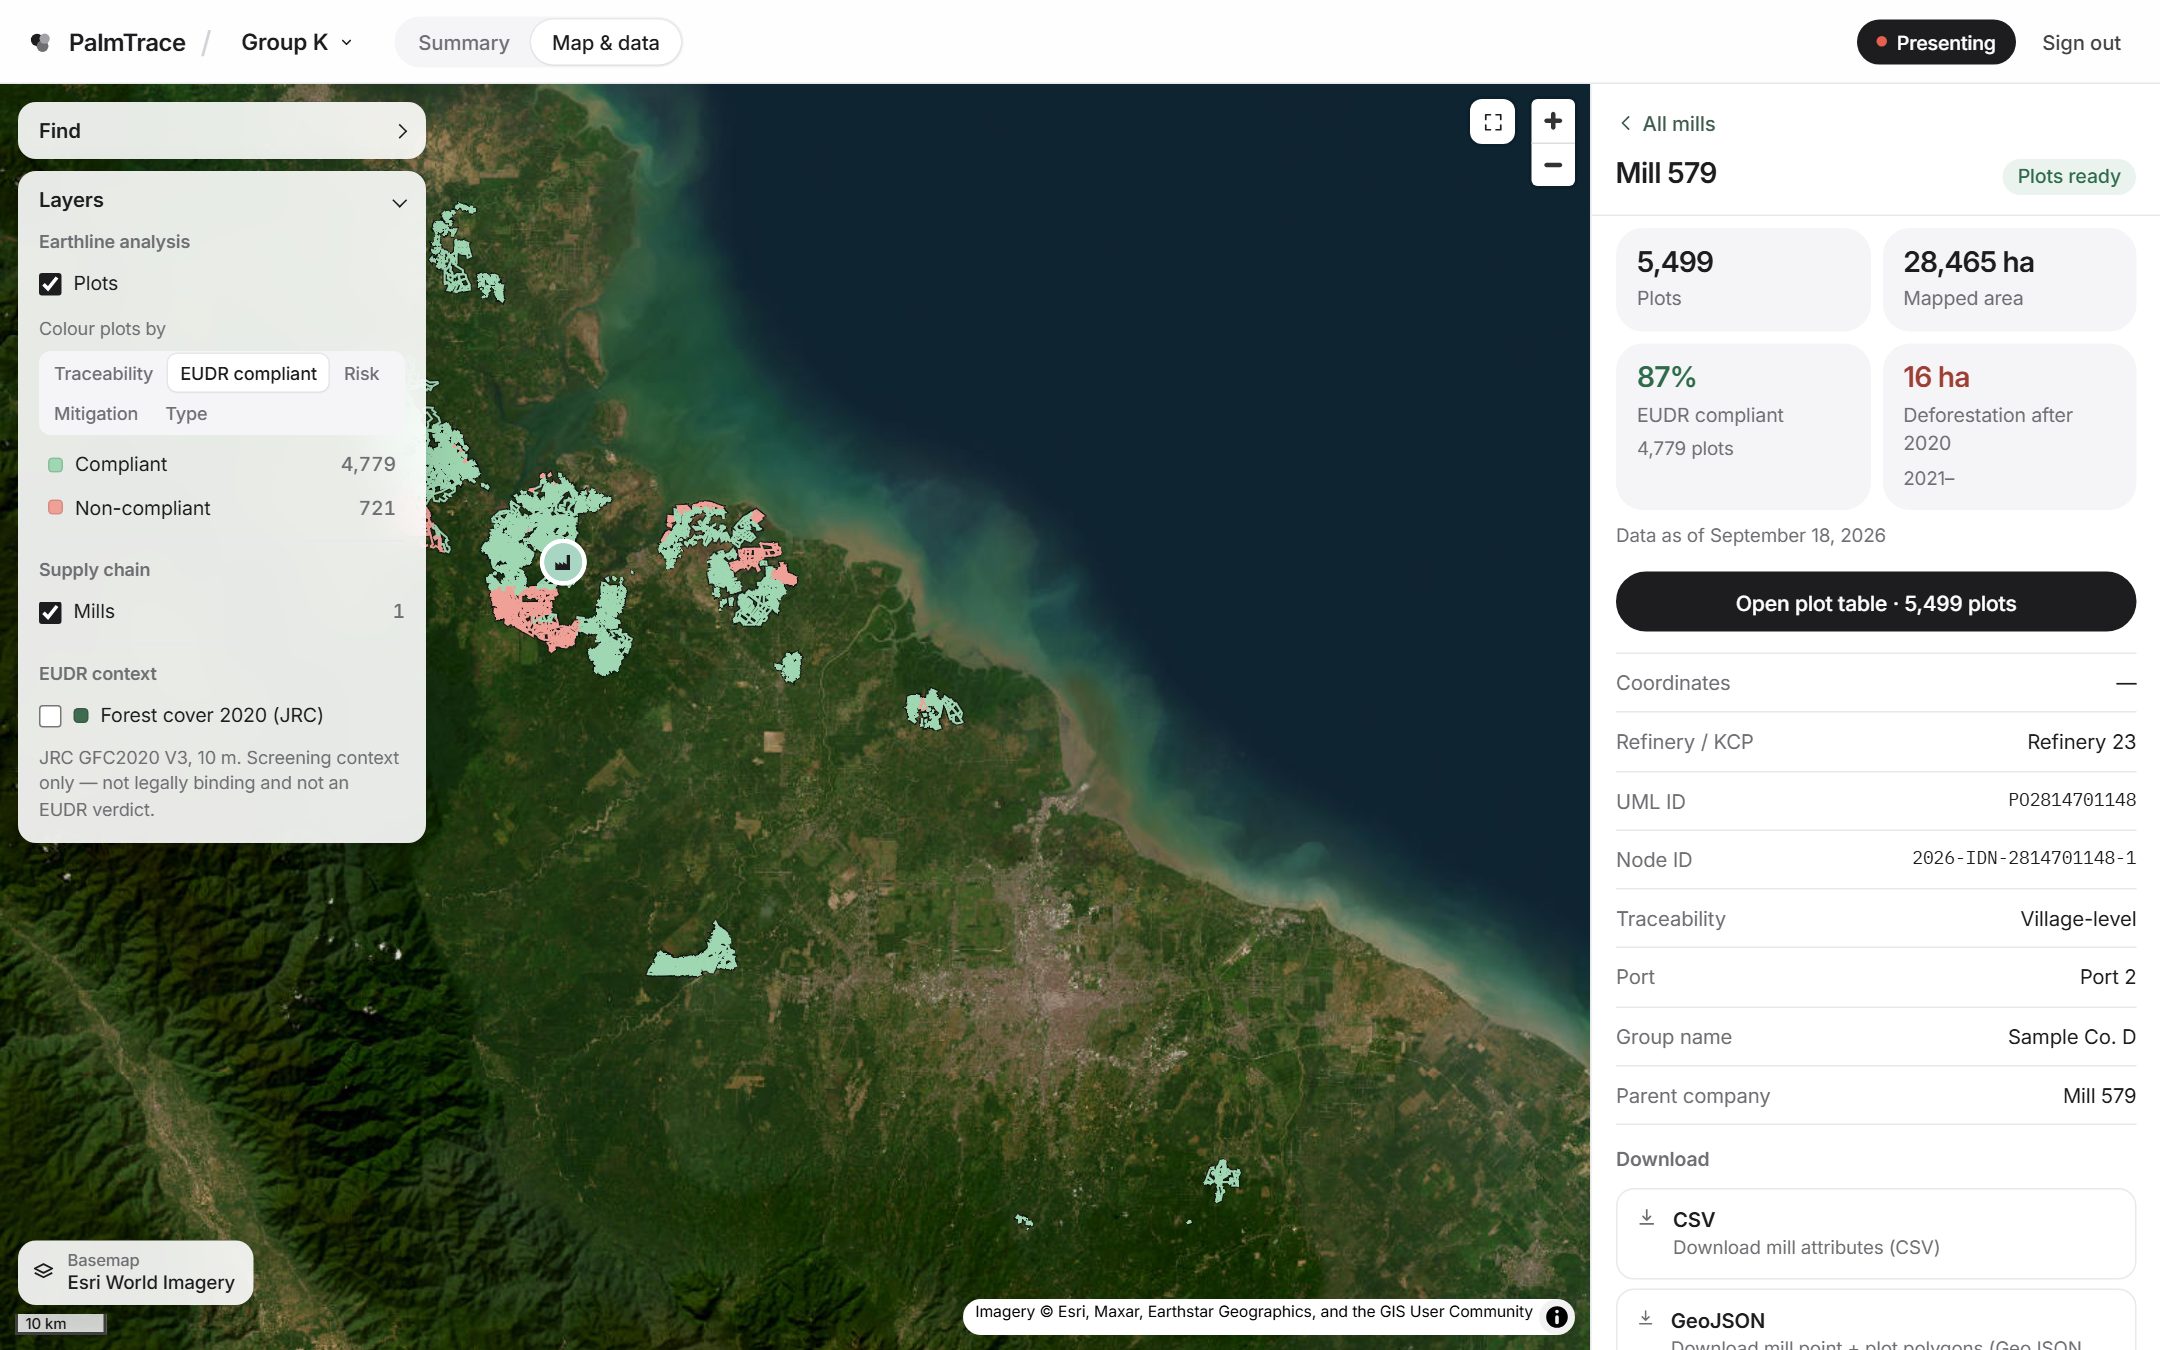
Every plot is tied to the mill it supplies and that mill's traceability level — village boundary or buffer — so a buyer can follow the fruit from the land it grew on to the mill that processed it, and see what that land looked like before and after the 2020 cutoff.
How it works
Refineries, KCPs, mills and their sourcing areas — village-level or buffer — in one ledger, each mill tied to its UML ID.
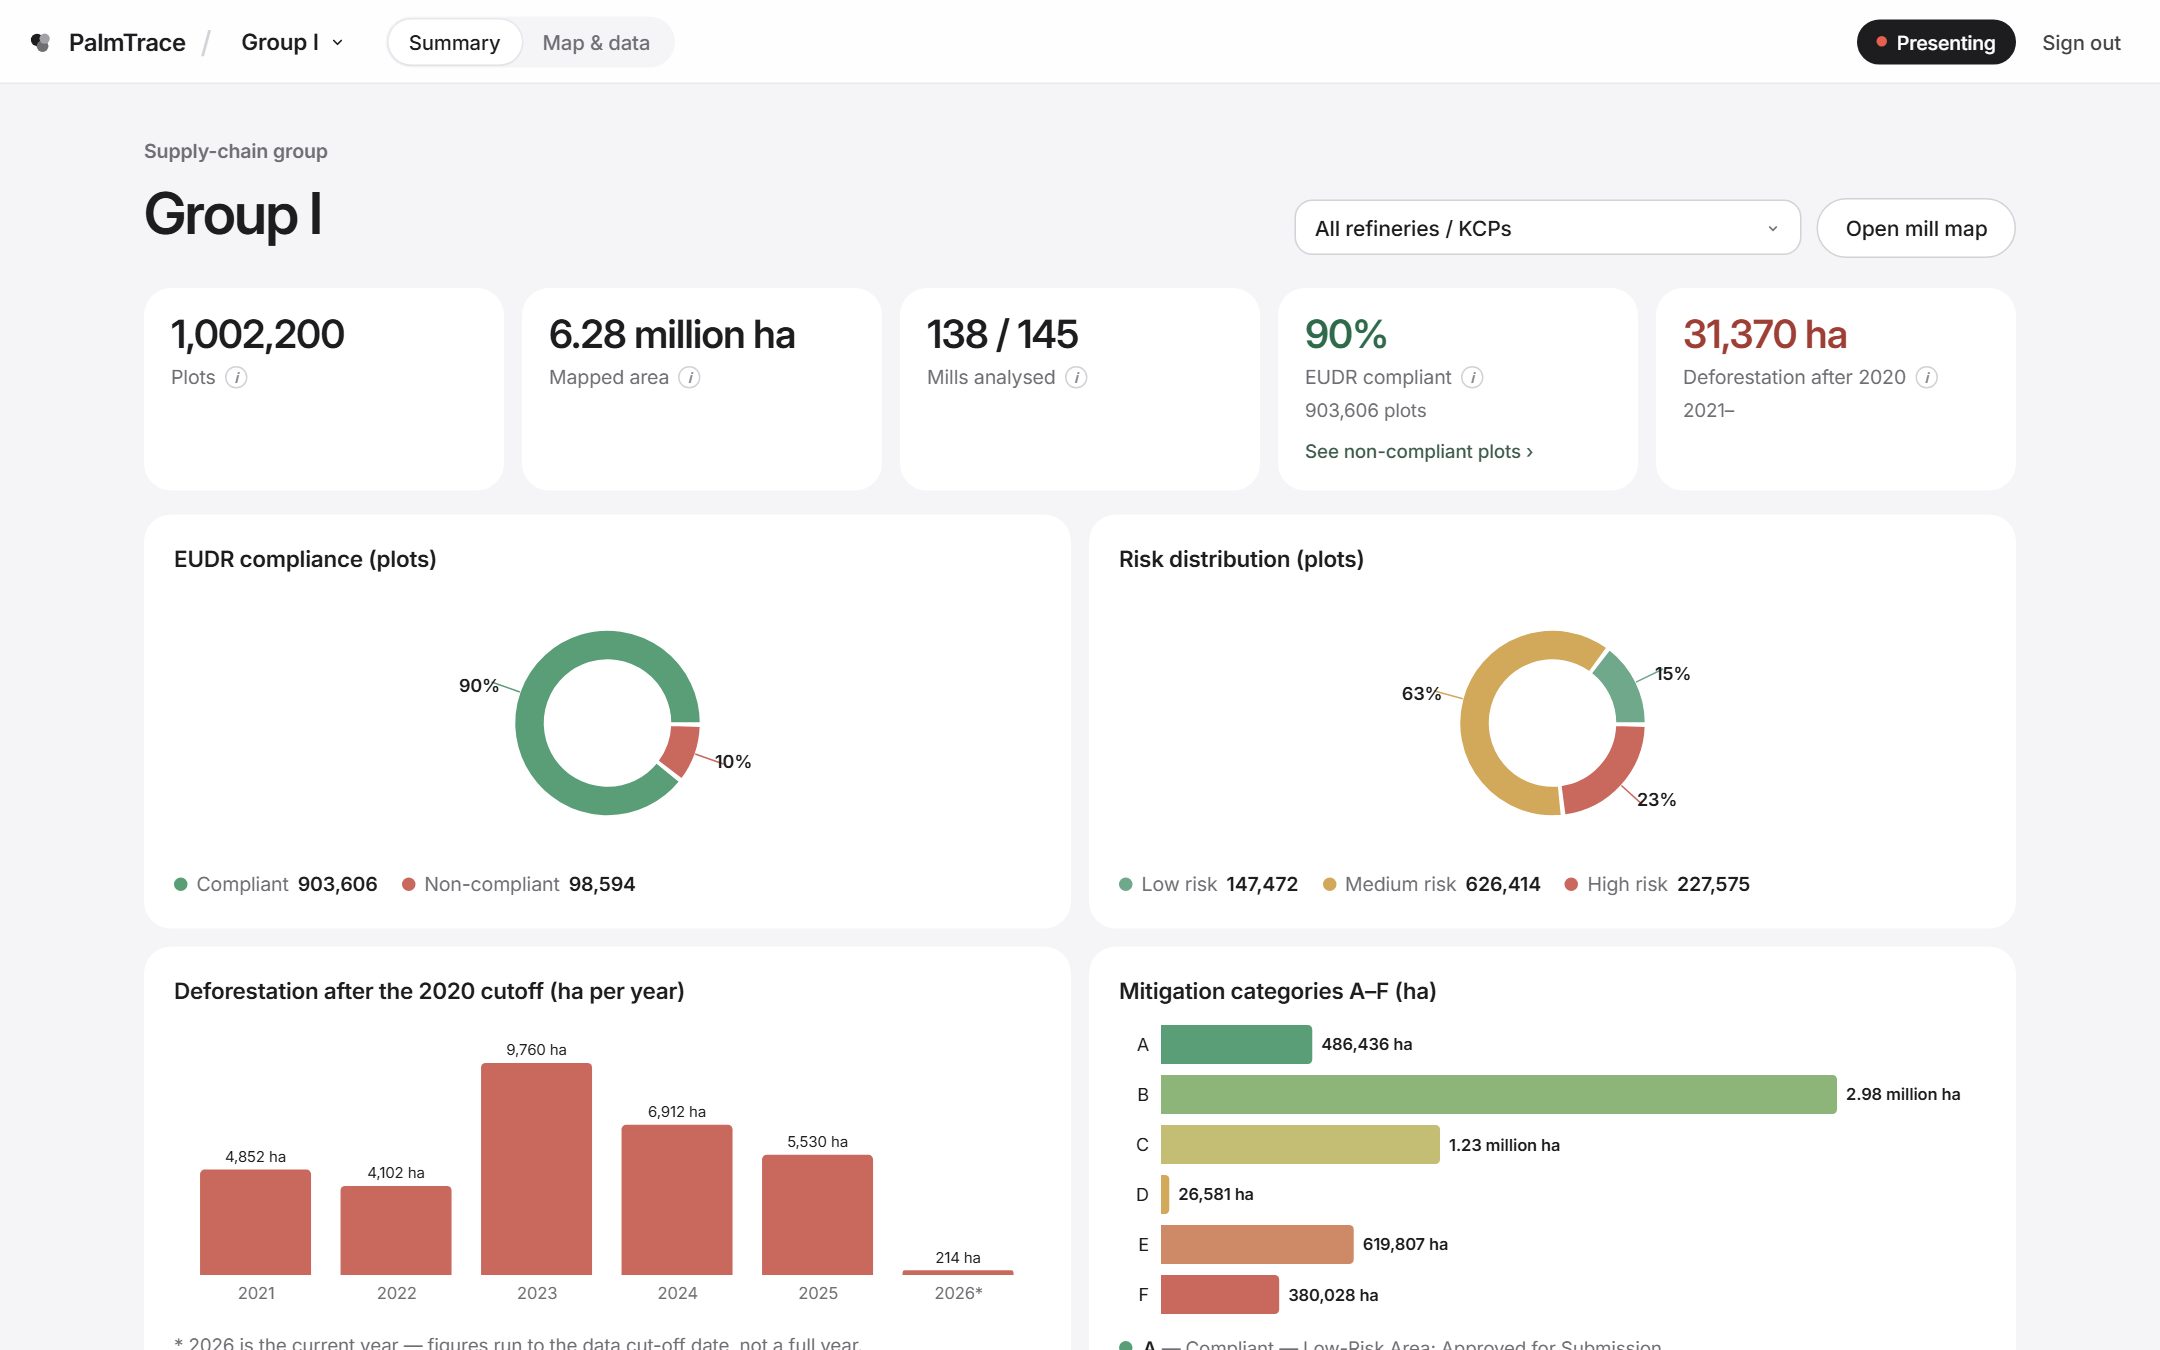
Each polygon is checked for deforestation after 2020, against JRC forest cover and the KLHK forest estate, and given one category from A to F.
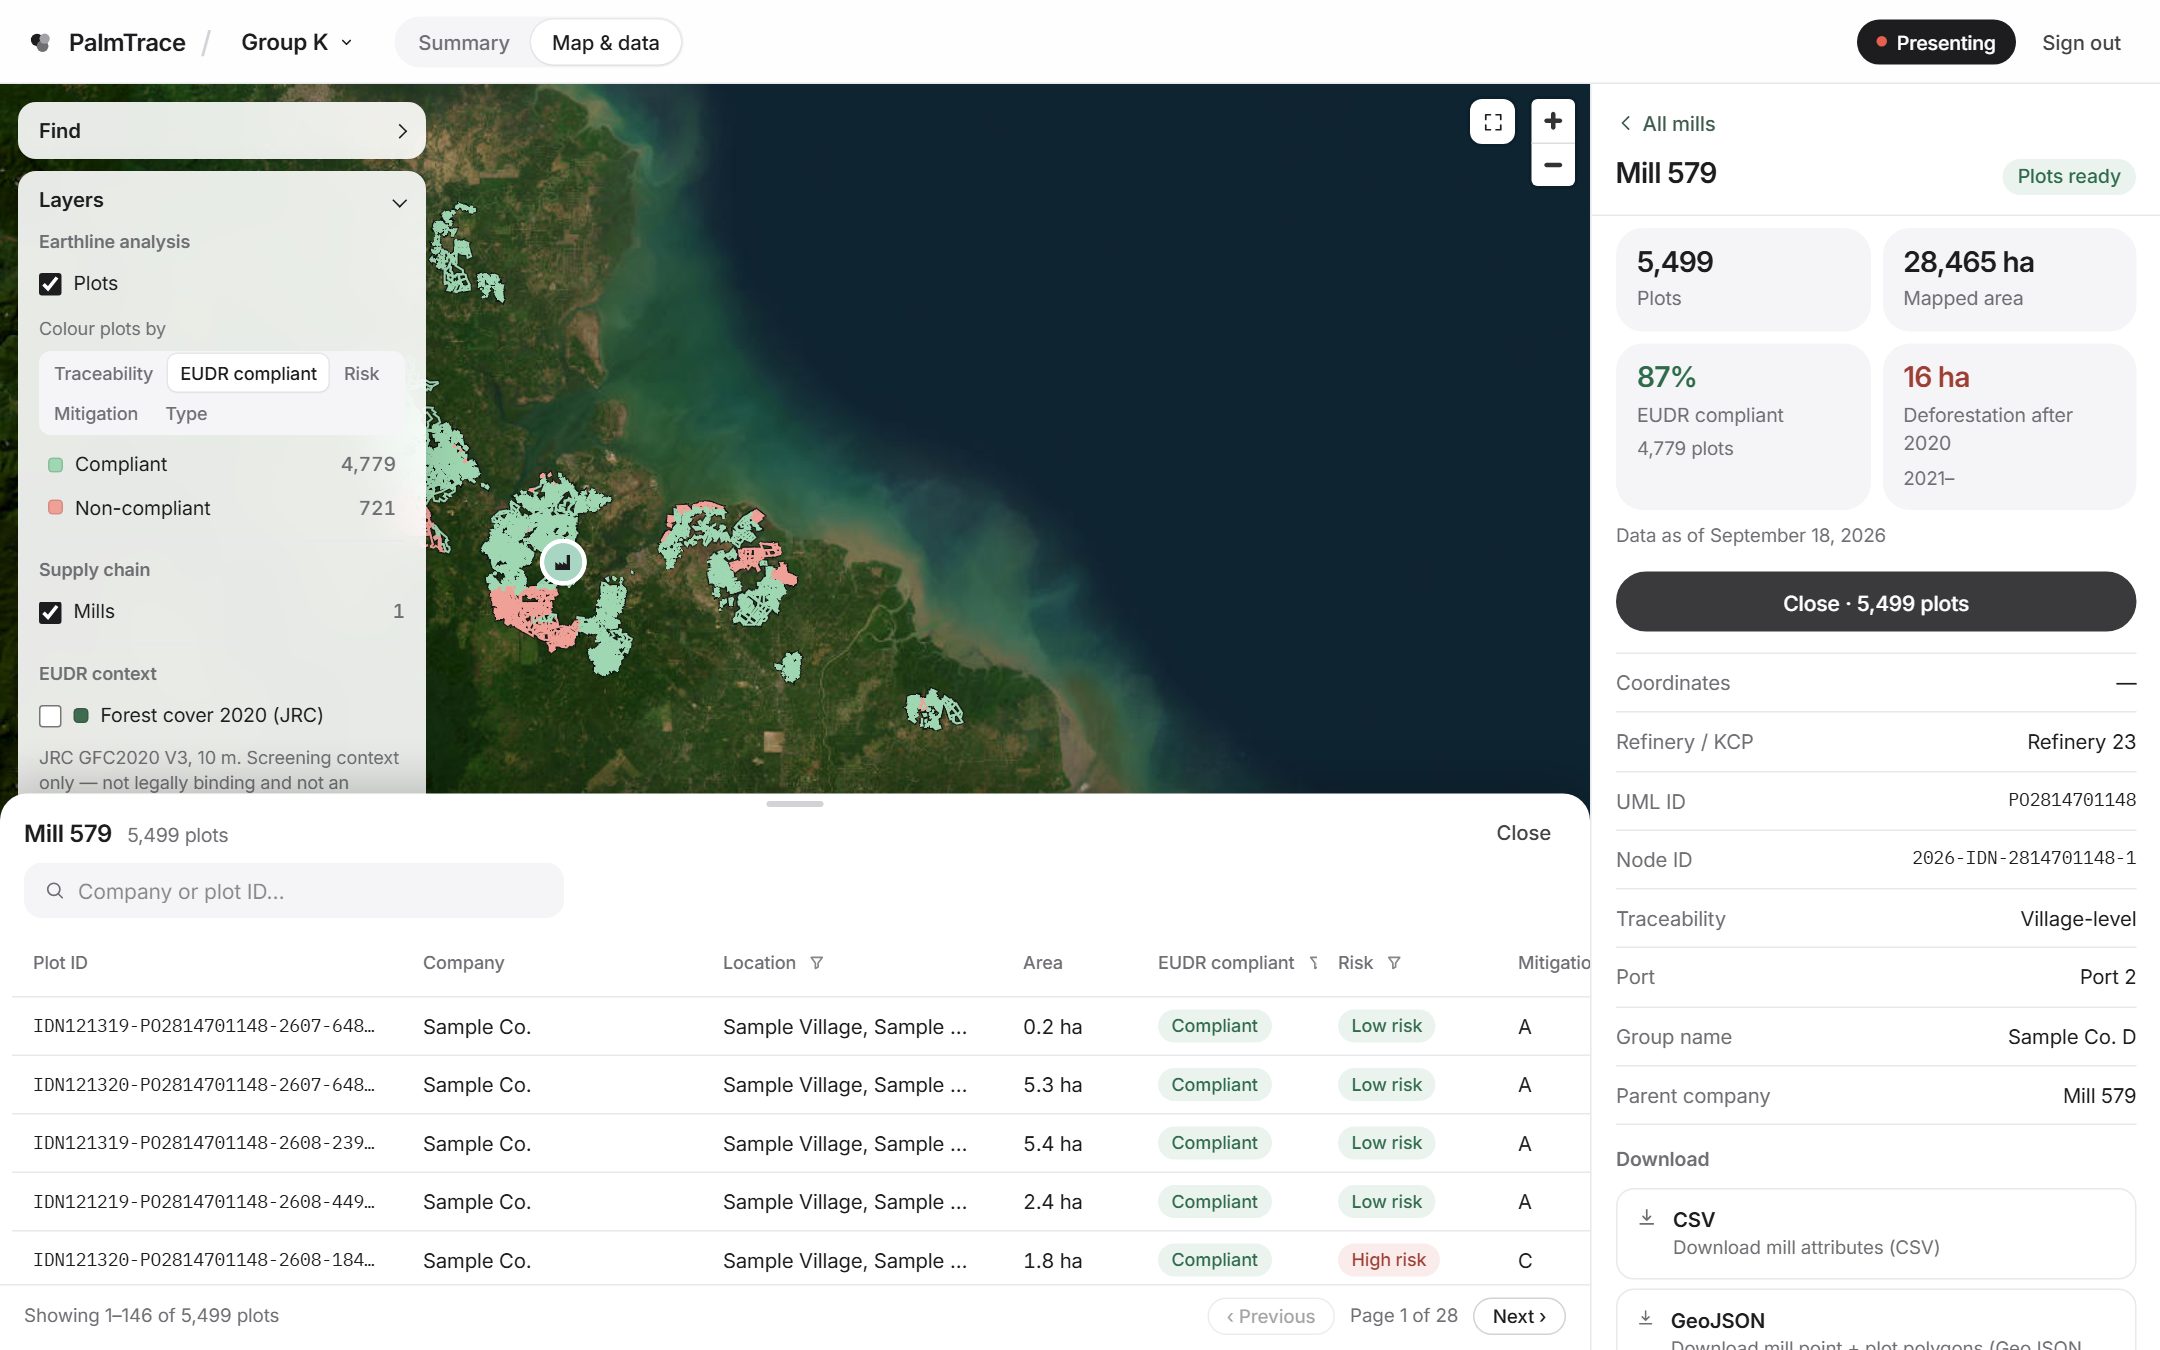
Open any plot to see its verdict and reasons, compare dated imagery, and download what you need. Suppliers see only their own chain.
Inside the workspace
Satellite basemaps, mills, sourcing areas and plots coloured by verdict, risk or mitigation. Click a plot for the full story.
One mitigation category per plot, from “approved for submission” to “not approved”.
Drag across the same plots in 2020 and 2026 — dated Sentinel-2 imagery either side of the cutoff.
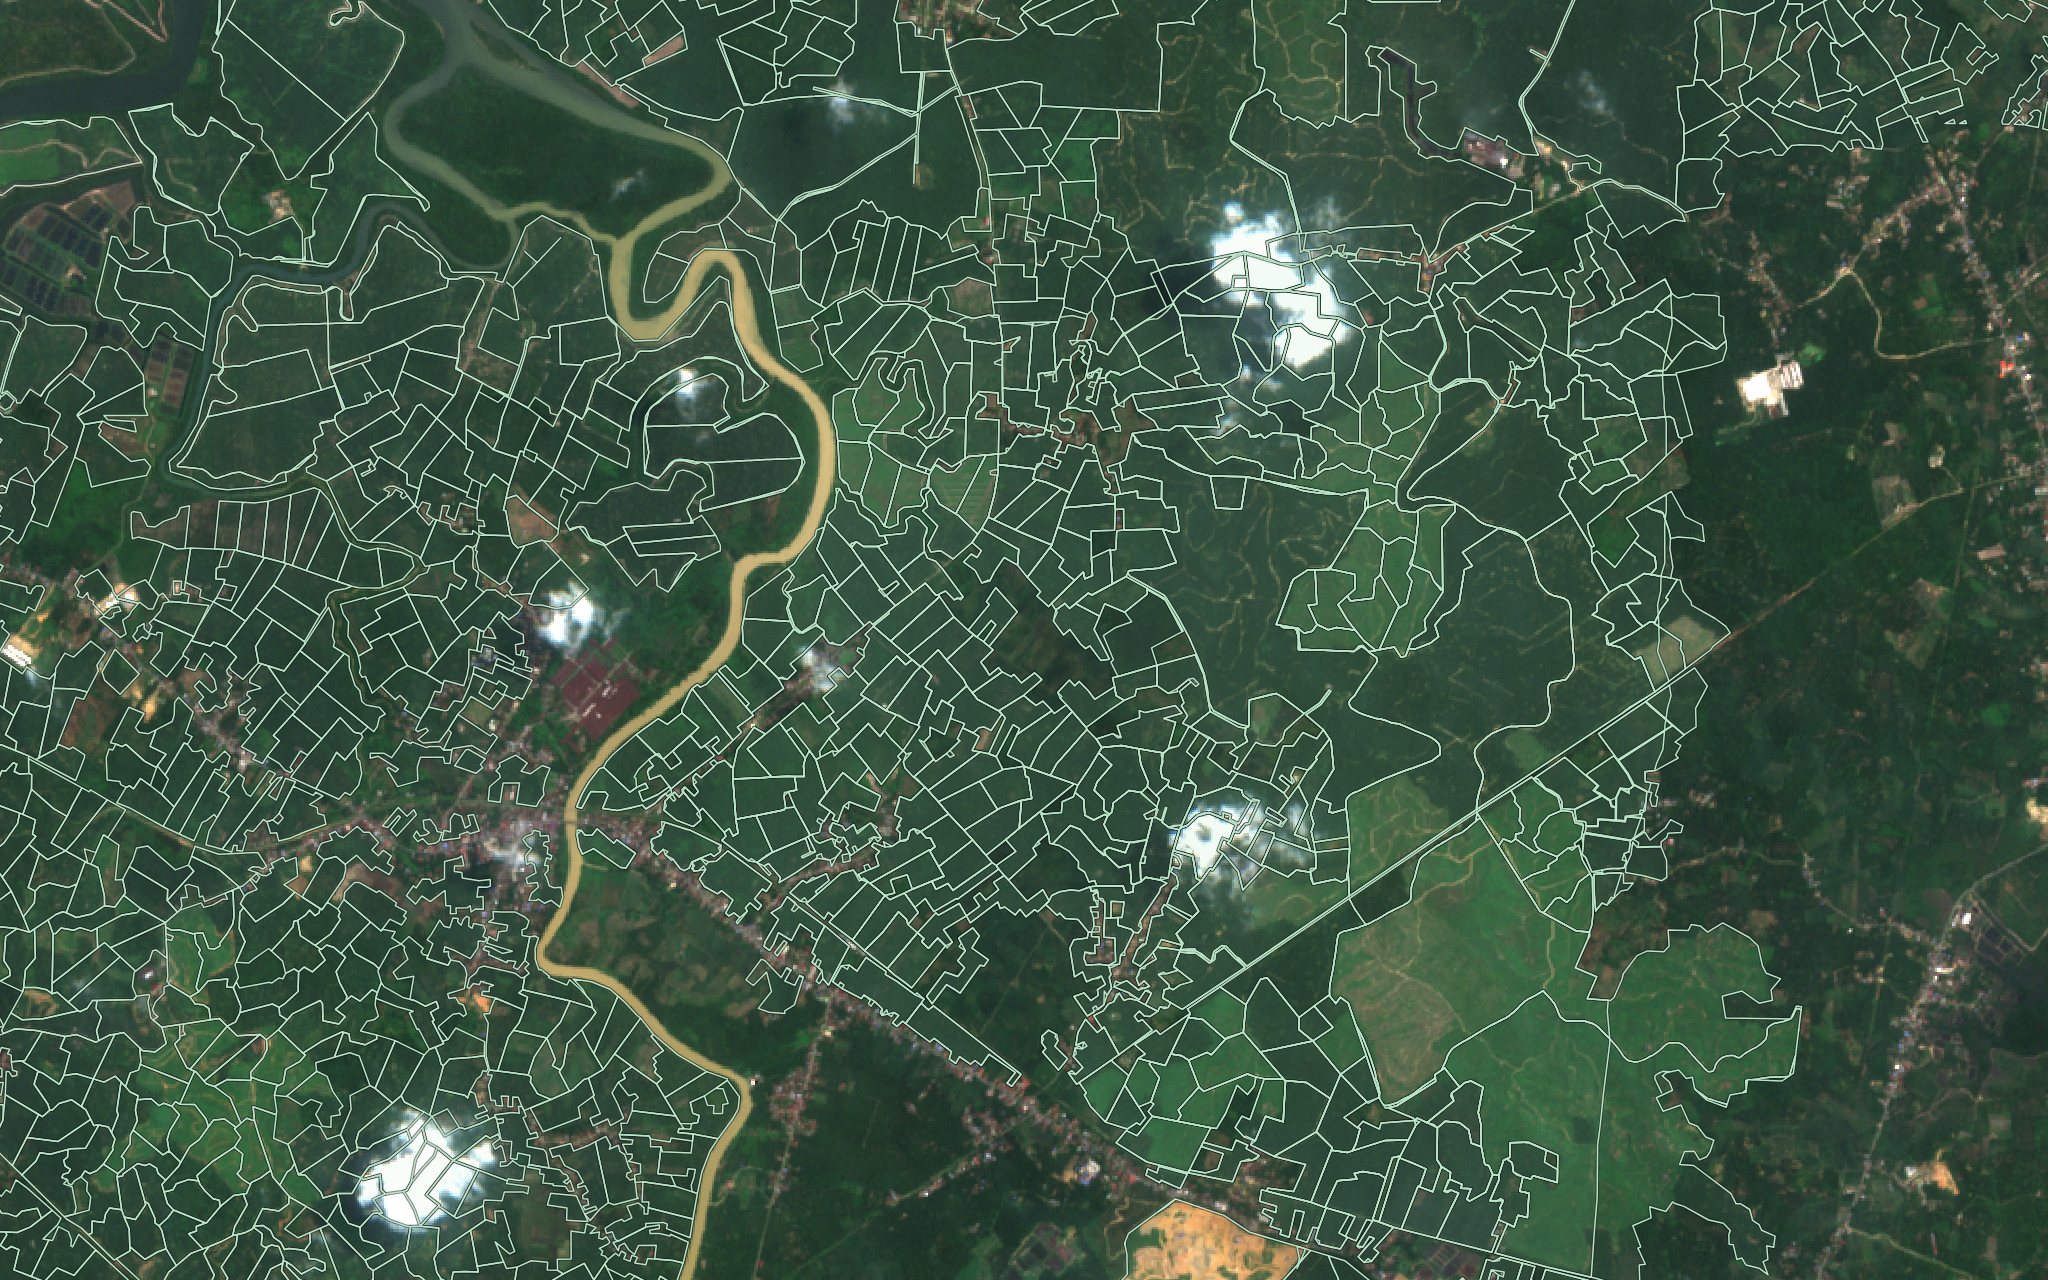
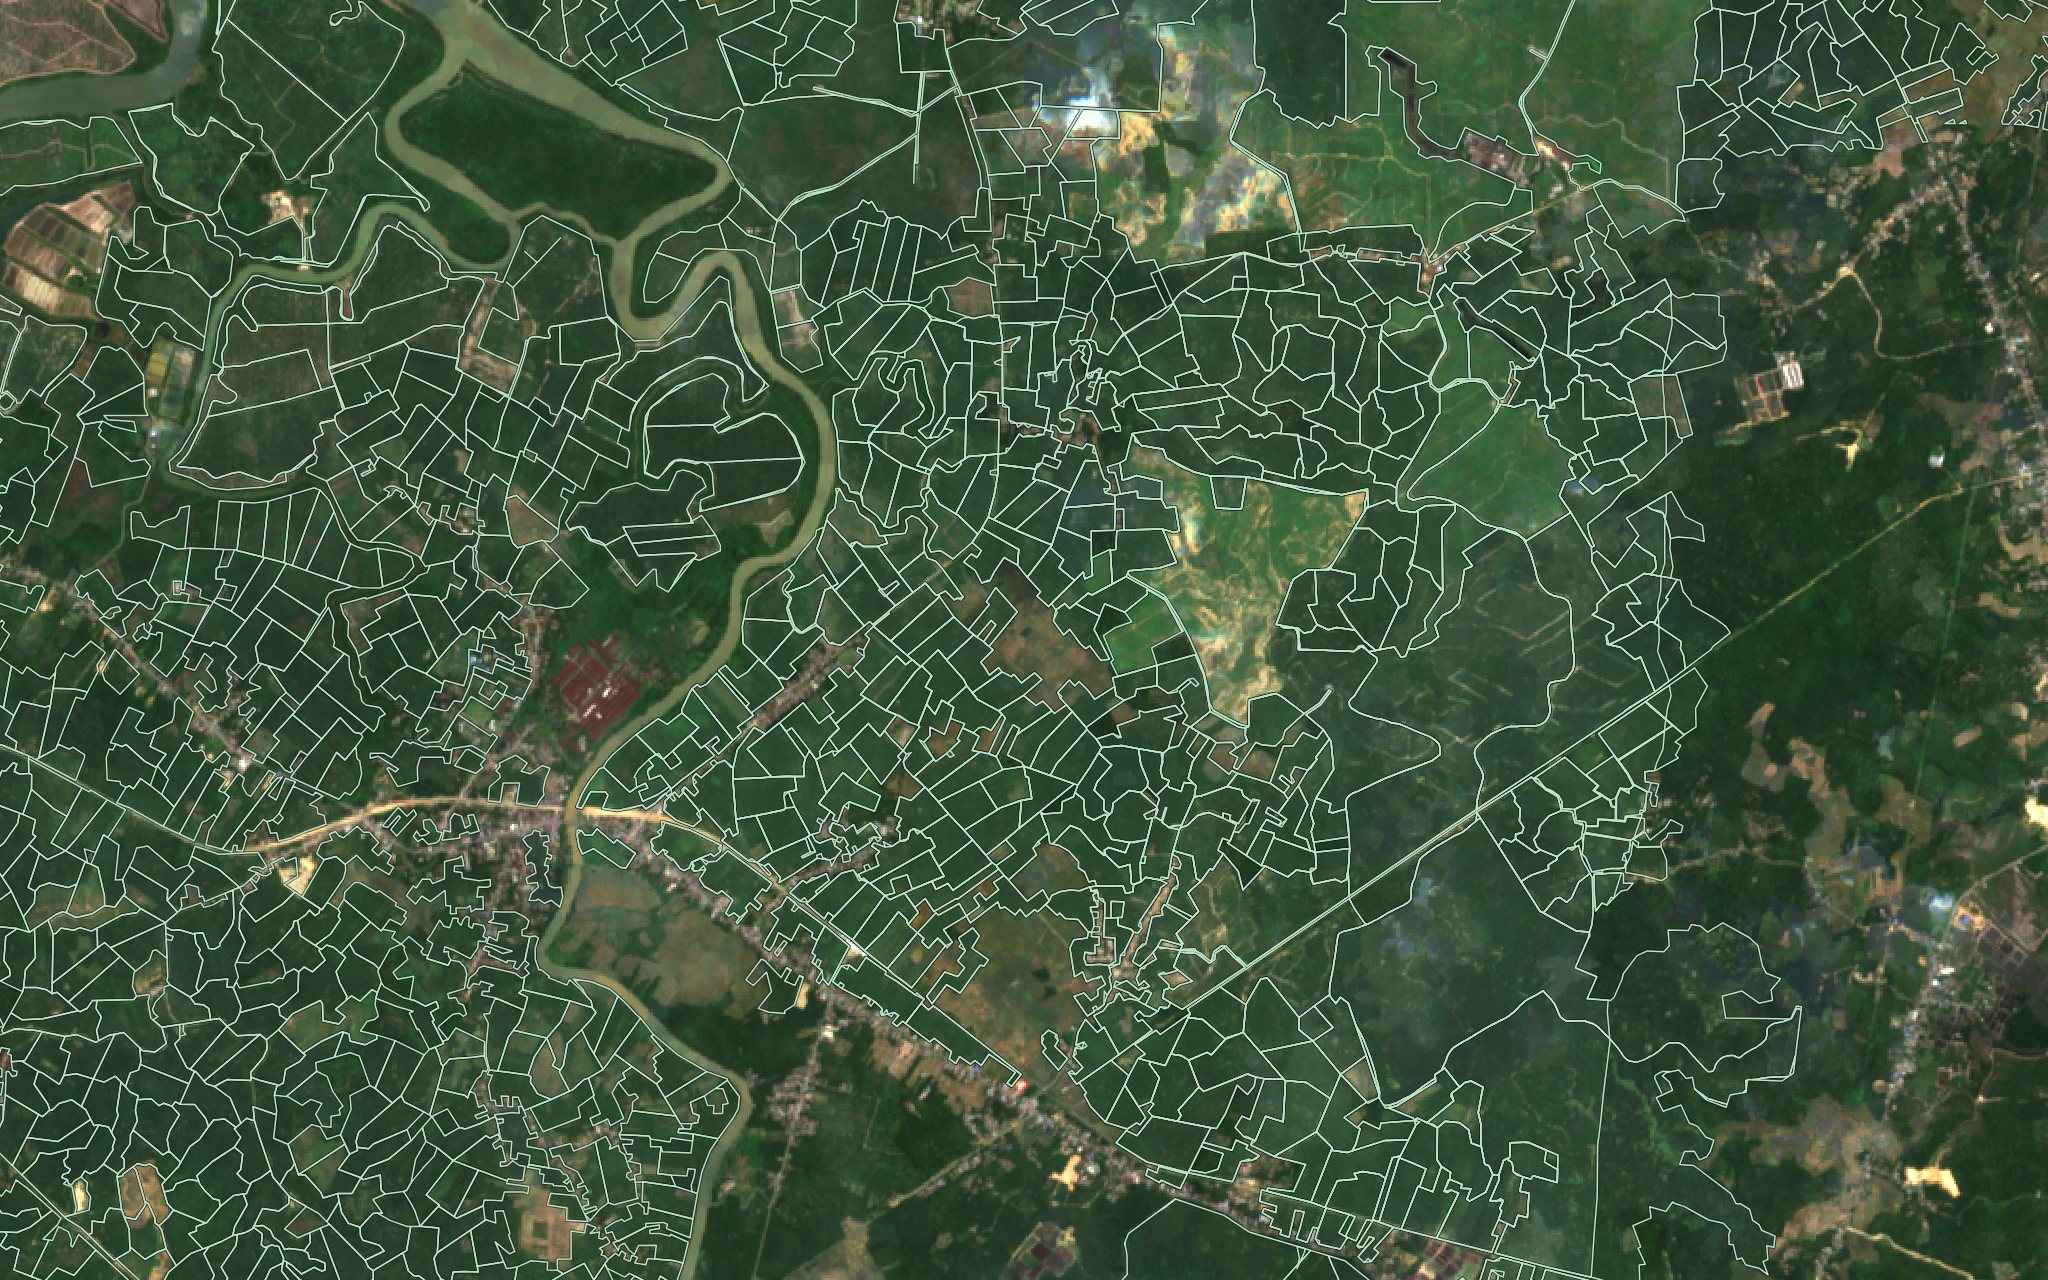 20202026
JRC forest cover and the KLHK forest estate are shown side by side — never blended into the verdict.
Every account is scoped to its own supply chain, checked on the server.
Every group, mill and view has its own address. Send a colleague exactly what you’re looking at.
Mill points and plot polygons as GeoJSON in WGS 84, mill attributes as CSV — ready for your own GIS or risk system.
Who it’s for
Answer EUDR and NDPE questions with plot-level evidence instead of declarations.
See which mills are covered, which are partly covered and which still need polygons before the next contract.
Check your own plots before your buyer does, and fix what fails.
Versus the usual way
Questions
No. PalmTrace is a screening and due-diligence tool. It shows where the evidence points and why; decisions under the law remain with you and the competent authorities.
Forest cover comes from the European Commission’s JRC Global Forest Cover 2020 map, which the JRC itself describes as non-binding. Legal forest-estate functions come from KLHK. Both are cited on the methodology page.
Only accounts you and Earthline agree on. Each account is limited to its own chain, and nothing from a client’s chain appears on this website.
Your mill list and plot polygons, in whatever form you have them. Earthline’s team prepares, checks and loads the data.
Yes. The whole workspace is available in Bahasa Indonesia and English, with the same terms in both.
PalmTrace is invitation-only. Request early access and Earthline will set up a workspace for your chain.
Also from Earthline
PalmTrace runs on the same imagery and survey work Earthline has delivered to plantations, mining, energy and forestry since 2001.
Workspaces are set up by Earthline for each supply chain. Ask for access, or write to us first.
CPO prices and market data are coming later.